The hardware and bandwidth for this mirror is donated by dogado GmbH, the Webhosting and Full Service-Cloud Provider. Check out our Wordpress Tutorial.
If you wish to report a bug, or if you are interested in having us mirror your free-software or open-source project, please feel free to contact us at mirror[@]dogado.de.
![]()
![]()
![]()
ggip is a {ggplot2} extension for visualizing IP addresses and networks stored in {ipaddress} vectors.
Here are some of the key features:
You can install the released version of ggip from CRAN with:
install.packages("ggip")Or you can install the development version from GitHub:
# install.packages("remotes")
remotes::install_github("davidchall/ggip")Plotting with {ggip} follows most of the conventions set by {ggplot2}. A major difference
is that coord_ip() is required to map IP data to the 2D
grid (addresses to points and networks to rectangles). Learn more in
vignette("ggip").
Here’s a quick showcase of what’s possible:
library(tidyverse)
library(ggfittext)
library(ggip)

ggplot(ip_data) +
  stat_summary_address(aes(ip = address)) +
  geom_hilbert_outline(color = "grey80") +
  geom_fit_text(
    aes(
      xmin = network$xmin, xmax = network$xmax,
      ymin = network$ymin, ymax = network$ymax,
      label = label
    ),
    data = iana_ipv4 %>% filter(allocation == "Reserved"),
    color = "#fdc086", grow = TRUE
  ) +
  scale_fill_viridis_c(name = NULL, trans = "log2", na.value = "black") +
  coord_ip(pixel_prefix = 20) +
  theme_ip_dark()
#> Warning: Transformation introduced infinite values in discrete y-axis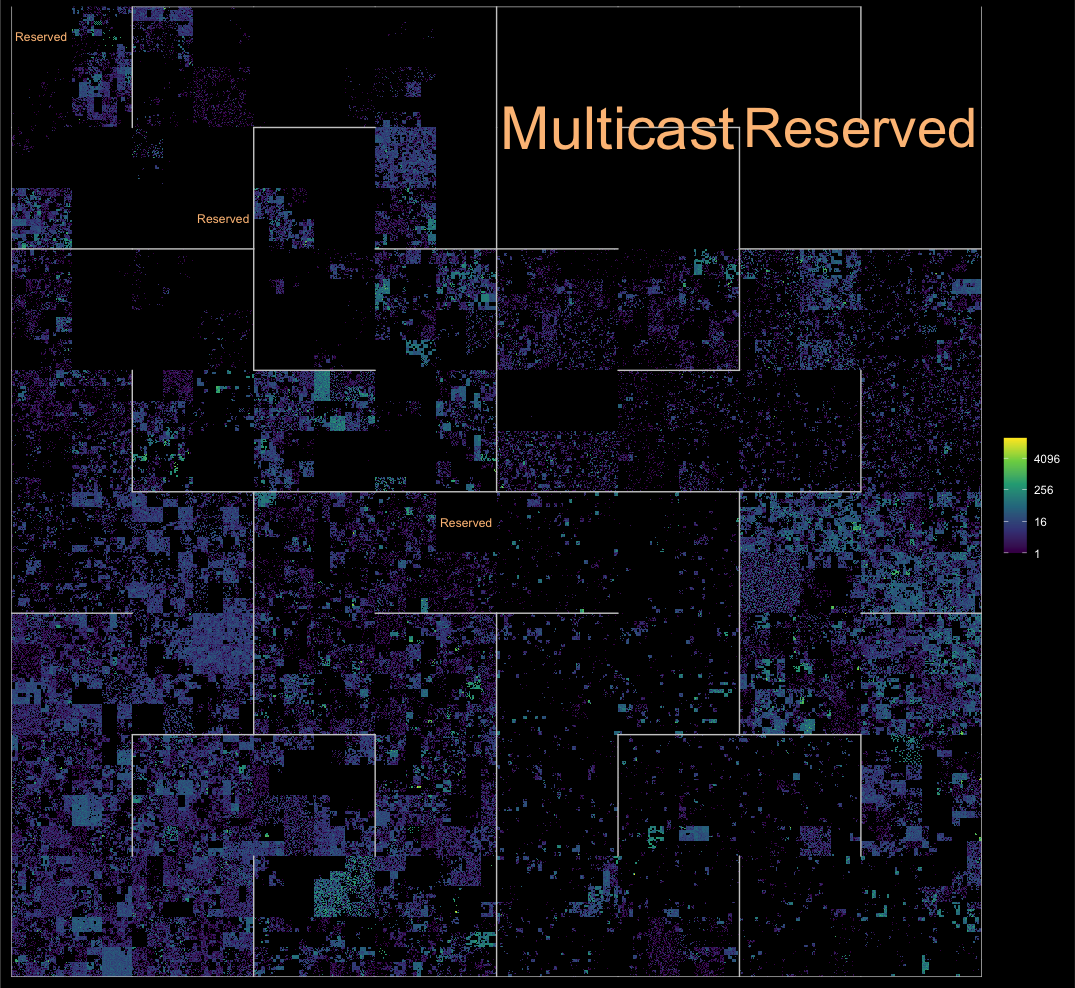
These binaries (installable software) and packages are in development.
They may not be fully stable and should be used with caution. We make no claims about them.
Health stats visible at Monitor.