
The hardware and bandwidth for this mirror is donated by dogado GmbH, the Webhosting and Full Service-Cloud Provider. Check out our Wordpress Tutorial.
If you wish to report a bug, or if you are interested in having us mirror your free-software or open-source project, please feel free to contact us at mirror[@]dogado.de.


Here are a few examples of plots you can create with
gghotelling:
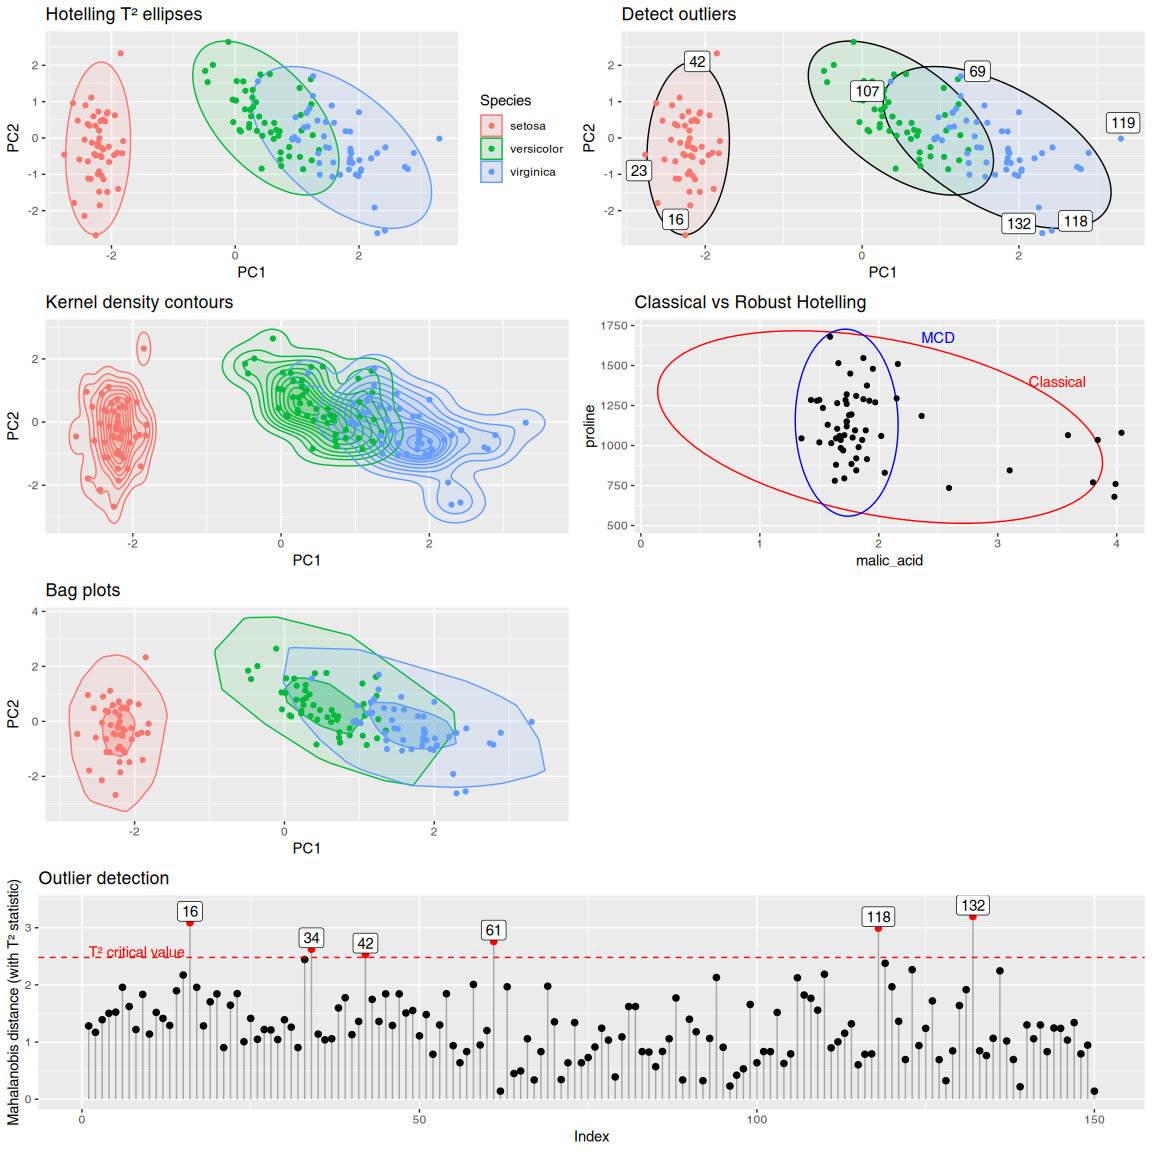
geom_hotelling()robust=TRUEtype="t2mean"geom_kde()outliers()stat_outliers() and
plot_outliers()geom_hull()geom_bag()prcomp objectsSee the vignette for more details.
You can install the development version of gghotelling from GitHub with:
# install.packages("pak")
pak::pak("january3/gghotelling")The package defines a new geom, geom_hotelling(), which
can be used to add Hotelling ellipses to ggplot2 scatter plots. Here are
two examples of usage:
library(ggplot2)
library(gghotelling)

pca <- prcomp(iris[, 1:4], scale.=TRUE)
df <- cbind(iris, pca$x)

# minimum example
p1 <- ggplot(df, aes(PC1, PC2, color=Species)) +
  geom_hotelling() +
  geom_point()

# set custom CI/coverage level
p2 <- ggplot(df, aes(PC1, PC2, color=Species)) +
  geom_hotelling(alpha=0.1, aes(fill = Species), level=.99) +
  geom_point()

cowplot::plot_grid(p1, p2, ncol=2)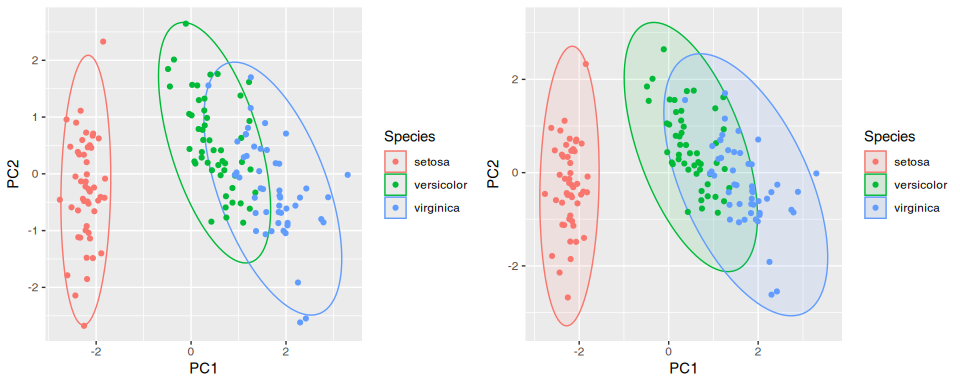
I used LLM modes to a) detect bugs, spelling errors, clerical
mistakes and other deficiencies in the code and b) better understand the
ggplot2 specific code (especially after_stat()).
Furthermore, I used devtools, checktor and covr.
These binaries (installable software) and packages are in development.
They may not be fully stable and should be used with caution. We make no claims about them.
Health stats visible at Monitor.