The hardware and bandwidth for this mirror is donated by dogado GmbH, the Webhosting and Full Service-Cloud Provider. Check out our Wordpress Tutorial.
If you wish to report a bug, or if you are interested in having us mirror your free-software or open-source project, please feel free to contact us at mirror[@]dogado.de.
![]()
![]()
![]()
You know how to make ggplot2 graphics, right? No
worries. Piece of cake.
Now, can you please rotate the x axis labels to
vertical?
ggeasy is here to make that a little easier.
You can install the latest released version of ggeasy
from CRAN with:
install.packages("ggeasy")or the bleeding-edge development version from GitHub with
# install.packages("remotes")
remotes::install_github("jonocarroll/ggeasy")See the pkgdown
site.
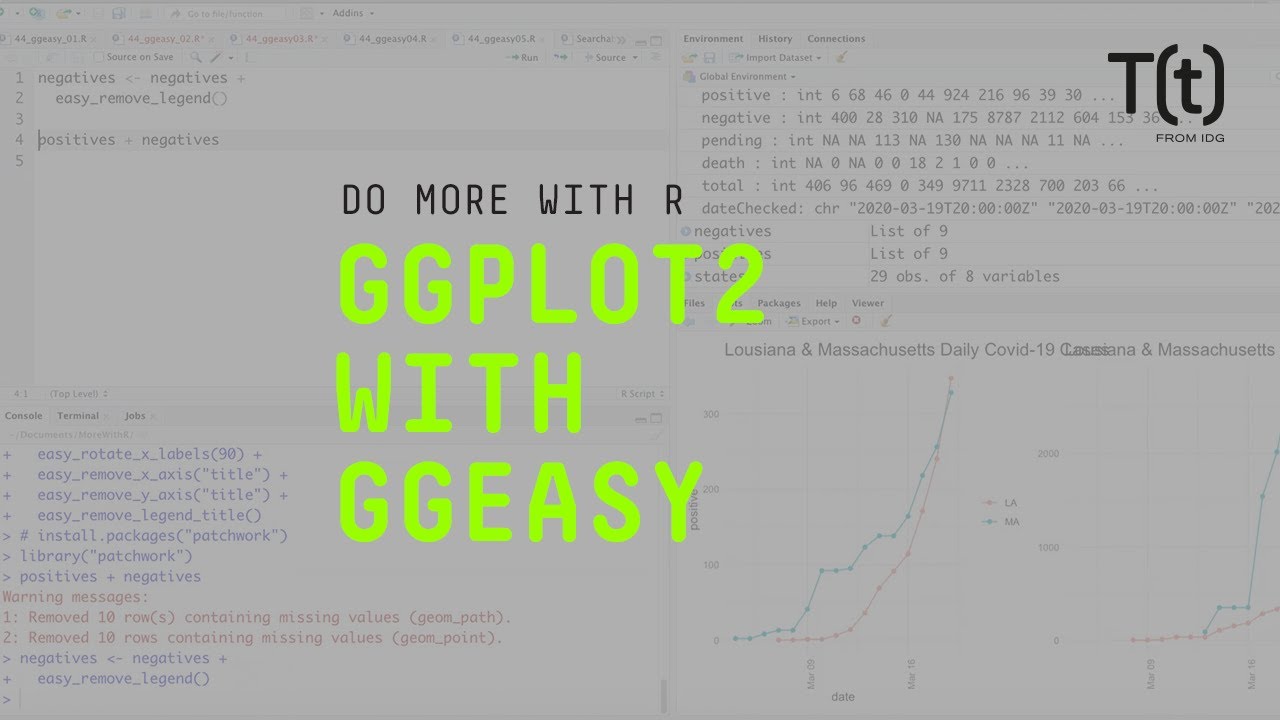
@amrrs a.k.a. @1littlecoder has produced a video
walkthrough using ggeasy which covers some of the major
features:

Sharon Machlis has a great article detailing using the package, as well as a video
library(ggplot2)
library(ggeasy)

# rotate x axis labels
ggplot(mtcars, aes(hp, mpg)) +
    geom_point() +
    easy_rotate_x_labels()
# rotate y axis labels
ggplot(mtcars, aes(hp, mpg)) +
    geom_point() +
    easy_rotate_y_labels()
# remove 'size' legend
ggplot(mtcars, aes(wt, mpg, colour = cyl, size = hp)) +
    geom_point() +
    easy_remove_legend(size)
# make the x axis labels larger
ggplot(mtcars, aes(mpg, hp)) +
  geom_point() +
  easy_x_axis_labels_size(22)
# make all the text red
ggplot(mtcars, aes(mpg, hp)) +
  geom_point(aes(fill = gear)) +
  easy_all_text_color("red")
# remove just x axis
ggplot(mtcars, aes(wt, mpg)) +
  geom_point() +
  easy_remove_x_axis()
# remove y axis ticks
ggplot(mtcars, aes(wt, mpg)) +
  geom_point() +
  easy_remove_y_axis(what = "ticks")
# move legends to bottom
ggplot(mtcars, aes(wt, mpg, colour = cyl, size = hp)) +
  geom_point() +
  easy_move_legend("bottom")
# move legend to left side
ggplot(mtcars, aes(wt, mpg, colour = cyl, size = hp)) +
  geom_point() +
  easy_legend_at("left")
# Make legends horizontal
ggplot(mtcars, aes(wt, mpg, colour = cyl, size = hp)) +
  geom_point() + easy_rotate_legend("horizontal")
These functions will try to teach you the ‘official’ way to achieve
these goal, usually via the teach argument (where
implemented)
ggplot(mtcars, aes(hp, mpg)) +
    geom_point() +
    easy_rotate_y_labels(angle = "startatbottom", teach = TRUE)
#> easy_rotate_y_labels call can be substituted with:
#> theme(axis.text.y = element_text(angle = 90, hjust = 0))
ggplot(mtcars, aes(wt, mpg)) +
  geom_point() +
  easy_remove_y_axis(what = "ticks", teach = TRUE)
#> easy_remove_y_axis call can be substituted with:
#> theme(axis.ticks.y = element_blank())
Many thanks to Sébastien Rochette (@statnmap) for the design and execution of the hex logo.
These binaries (installable software) and packages are in development.
They may not be fully stable and should be used with caution. We make no claims about them.
Health stats visible at Monitor.