

The hardware and bandwidth for this mirror is donated by dogado GmbH, the Webhosting and Full Service-Cloud Provider. Check out our Wordpress Tutorial.
If you wish to report a bug, or if you are interested in having us mirror your free-software or open-source project, please feel free to contact us at mirror[@]dogado.de.
gganime renders a ggplot2 plot written with gganimate syntax as an animated SVG.
The output is a self-contained HTML widget powered by Anime.js (through the animejs package), instead
of a GIF or a video.
Because the animation is a single SVG with a timeline over its attributes:
install.packages("gganime")Or the development version from GitHub:
# install.packages("pak")
pak::pak("long39ng/gganime")Write the plot exactly as you would with gganimate, then call
anime() instead of animate(). Here
transition_time() animates over a continuous variable,
sizing each country’s bubble by population and filling in the
{frame_time} label between years:
library(ggplot2)
library(gapminder)
library(gganime)

p <- ggplot(gapminder, aes(gdpPercap, lifeExp, size = pop, colour = country)) +
  geom_point(alpha = 0.7, show.legend = FALSE) +
  scale_colour_manual(values = country_colors) +
  scale_size(range = c(2, 12)) +
  scale_x_log10() +
  facet_wrap(~continent) +
  labs(title = "Year: {frame_time}", x = "GDP per capita", y = "life expectancy") +
  transition_time(year) +
  ease_aes("linear")

anime(p)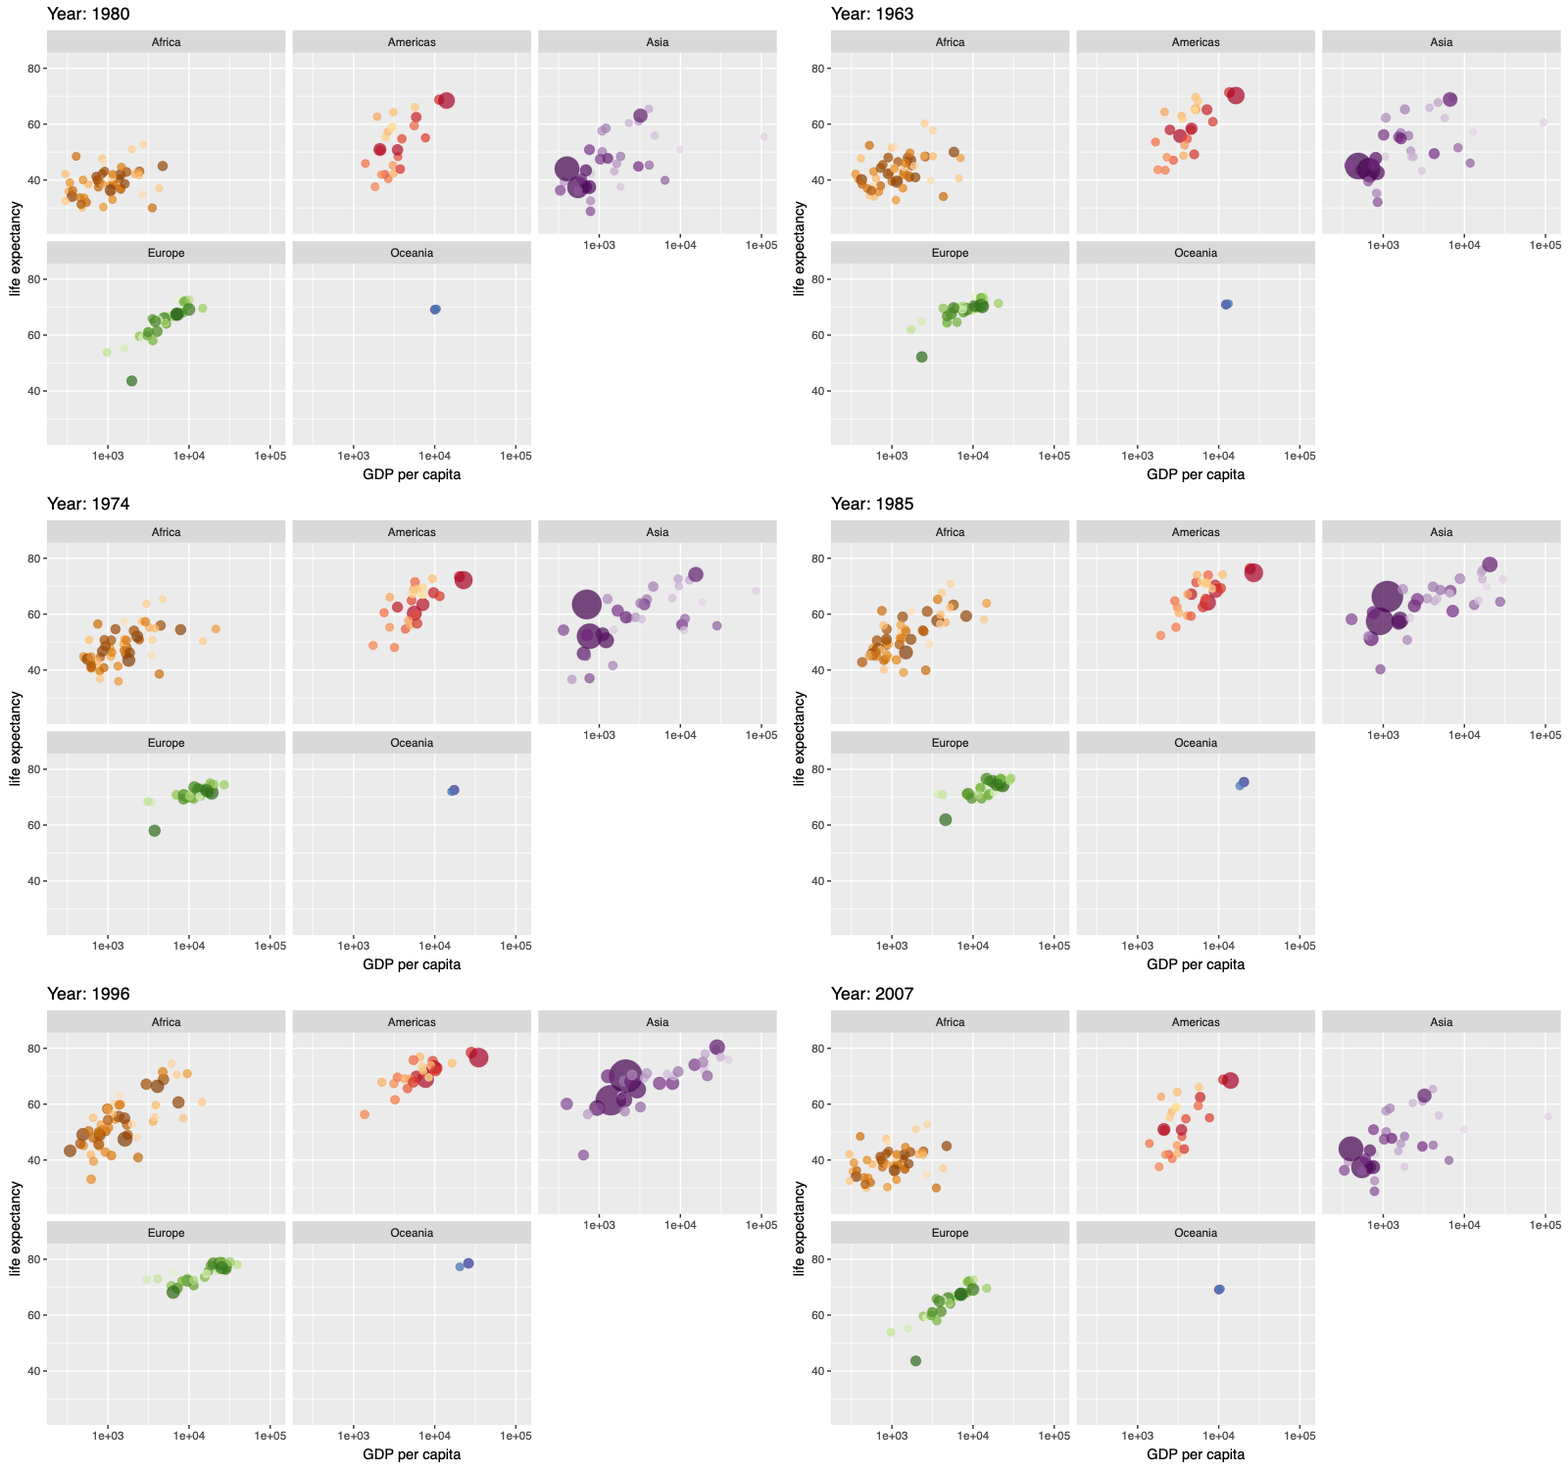
A shadow_mark() leaves earlier frames behind the current
one:
p <- ggplot(airquality, aes(Day, Temp)) +
  geom_point() +
  transition_time(Month) +
  shadow_mark(colour = "grey70") +
  labs(title = "Month: {frame_time}")

anime(p)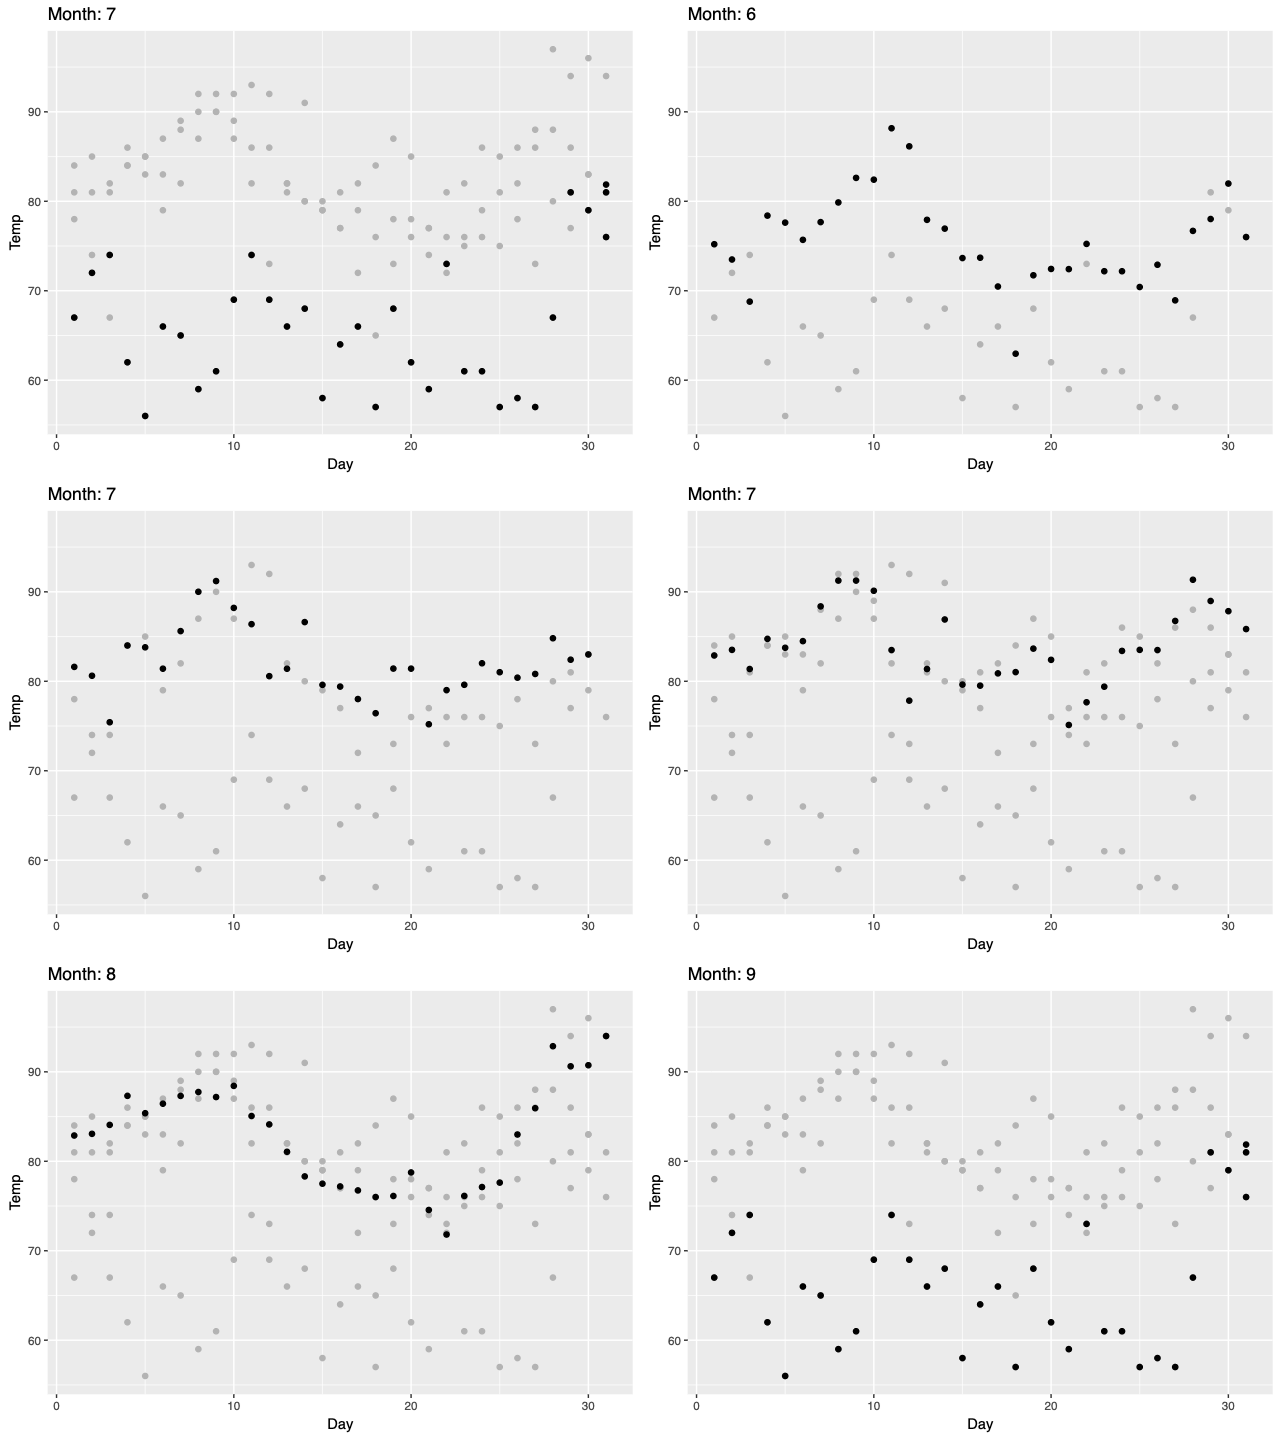
anime() returns an htmlwidget, so it prints in the
RStudio Viewer, embeds in R Markdown and Quarto, and saves with
htmlwidgets::saveWidget(). Loading gganime
also makes a bare gganimate plot print through anime() at
the console; set options(gganime.autoprint = FALSE) to keep
gganimate’s own output.
In Shiny, use gganimeOutput() and
renderGganime().
transition_states(),
transition_time(), transition_reveal().facet_wrap() and facet_grid(),
with fixed or free scales.coord_cartesian(), coord_fixed() /
coord_equal(), and coord_flip().enter_*() / exit_*(),
ease_aes(), and per-frame labels in the title, subtitle,
and caption.shadow_mark() and shadow_trail().Anything else stops with a message naming the alternative. Current
limits include non-Cartesian coordinate systems,
shadow_wake(), and view_*() other than
view_static().
These binaries (installable software) and packages are in development.
They may not be fully stable and should be used with caution. We make no claims about them.
Health stats visible at Monitor.