The hardware and bandwidth for this mirror is donated by dogado GmbH, the Webhosting and Full Service-Cloud Provider. Check out our Wordpress Tutorial.
If you wish to report a bug, or if you are interested in having us mirror your free-software or open-source project, please feel free to contact us at mirror[@]dogado.de.
ggbigQQ extends ggplot2 to allow the user to make a
quantile-quantile plot with a big dataset. Specifically,
geom_big_qq uses all the data provided to calculate
quantiles, but drops points that would overplot before plotting.
In this way, the resultant figure maintains all the accuracy of a Q-Q
plot made with a large dataset, but renders as fast as one from a
smaller dataset and, when stored as a vector graphic, has the file size
of a Q-Q plot from a smaller dataset.
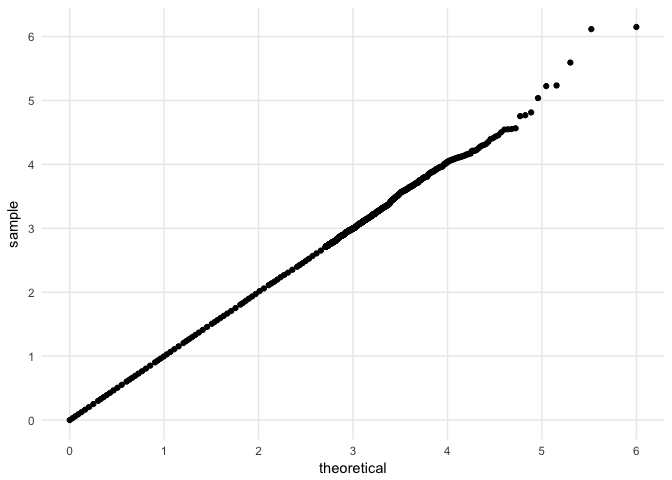
Here’s an example where geom_qq takes 14 seconds to
render the plot on my intel i5 and geom_big_qq takes 1
second to produce the same plot.
set.seed(27599)
d <- data.frame(s = runif(n = 5e5))

# # takes 14 seconds
# d %>%
#   ggplot(mapping = aes(sample = s)) +
#   geom_qq(distribution = qunif) +
#   QQ_scale_x() +
#   QQ_scale_y()


# takes 1 second
d %>%
  ggplot(mapping = aes(sample = s)) +
  geom_QQ_unif() +
  scale_x_QQ() +
  scale_y_QQ() +
  theme_minimal()
This geom works with other aesthetics, too.
set.seed(27599)
n <- 5e5
d <- data.frame(fac1 = sample(x = LETTERS[1:3], size = n, replace = TRUE),
                fac2 = sample(x = LETTERS[1:3], size = n, replace = TRUE),
                s = runif(n = n))

# takes 1 second
d %>%
  ggplot(mapping = aes(sample = s, color = fac1)) +
  geom_QQ_unif() +
  facet_wrap(~ fac2) +
  scale_x_QQ() +
  scale_y_QQ() +
  theme_minimal()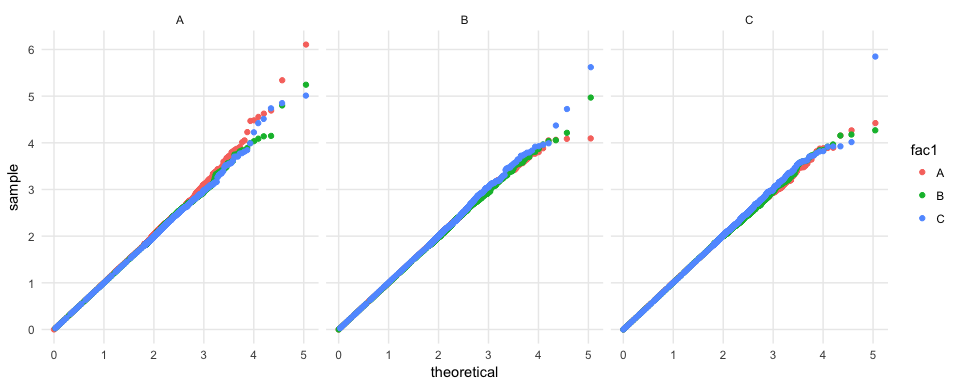
These binaries (installable software) and packages are in development.
They may not be fully stable and should be used with caution. We make no claims about them.
Health stats visible at Monitor.