The hardware and bandwidth for this mirror is donated by dogado GmbH, the Webhosting and Full Service-Cloud Provider. Check out our Wordpress Tutorial.
If you wish to report a bug, or if you are interested in having us mirror your free-software or open-source project, please feel free to contact us at mirror[@]dogado.de.

Effortlessly visualize all columns in a data frame with vertically aligned plots and automatic plot selection based on variable type. Plots are fully interactive, and custom tooltips can be added.
Why 1 dimensional plots?
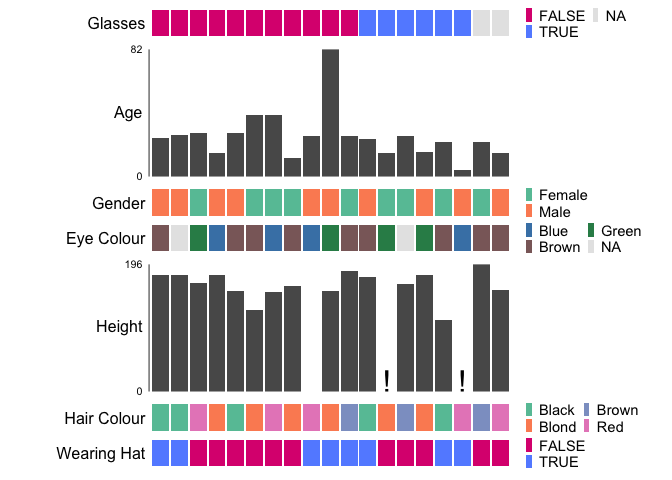
To understand trends in your data, especially correlative relationships between 2 or more features, it can be useful to densely stack visual representations of each feature vertically, regardless of data type. By unifying the \(x\)-axis across each plot, gg1d turns a series of 1D plots into an \(n\text{-dimensional}\) visualization where \(n = \text{number of columns in dataset}\). Note the key idea of gg1d is to ‘preserve the individual.’ gg1d does NOT plot distributions of properties, but rather each value of a feature for each subject/observation in the dataset.
gg1d can be used for exploratory data analysis (EDA) or to produce publication quality graphics summarizing a dataset.
install.packages("gg1d")You can install the development version of gg1d from GitHub with:
if (!require("remotes"))
    install.packages("remotes")

remotes::install_github("selkamand/gg1d")For examples of interactive gg1d plots see the gg1d gallery
# Load library
library(gg1d)

# Read data
path_gg1d <- system.file("example.csv", package = "gg1d")
df <- read.csv(path_gg1d, header = TRUE, na.strings = "")

# Plot data, sort by Glasses
gg1d(
  df,
  col_id = "ID",
  col_sort = "Glasses",
  interactive = FALSE,
  verbose = FALSE,
  options = gg1d_options(legend_nrow = 2)
)
Customise colours by supplying a named list to the
palettes argument
gg1d(
  df,
  col_id = "ID",
  col_sort = "Glasses",
  palettes = list("EyeColour" = c(
    Brown = "rosybrown4",
    Blue = "steelblue",
    Green = "seagreen"
  )),
  interactive = FALSE,
  verbose = FALSE,
  options = gg1d_options(legend_nrow = 2)
)
All types of contributions are encouraged and valued. See our guide to community contributions for different ways to help.
These binaries (installable software) and packages are in development.
They may not be fully stable and should be used with caution. We make no claims about them.
Health stats visible at Monitor.