

The hardware and bandwidth for this mirror is donated by dogado GmbH, the Webhosting and Full Service-Cloud Provider. Check out our Wordpress Tutorial.
If you wish to report a bug, or if you are interested in having us mirror your free-software or open-source project, please feel free to contact us at mirror[@]dogado.de.
This is a package centered around Portuguese spatial data. The main features are:
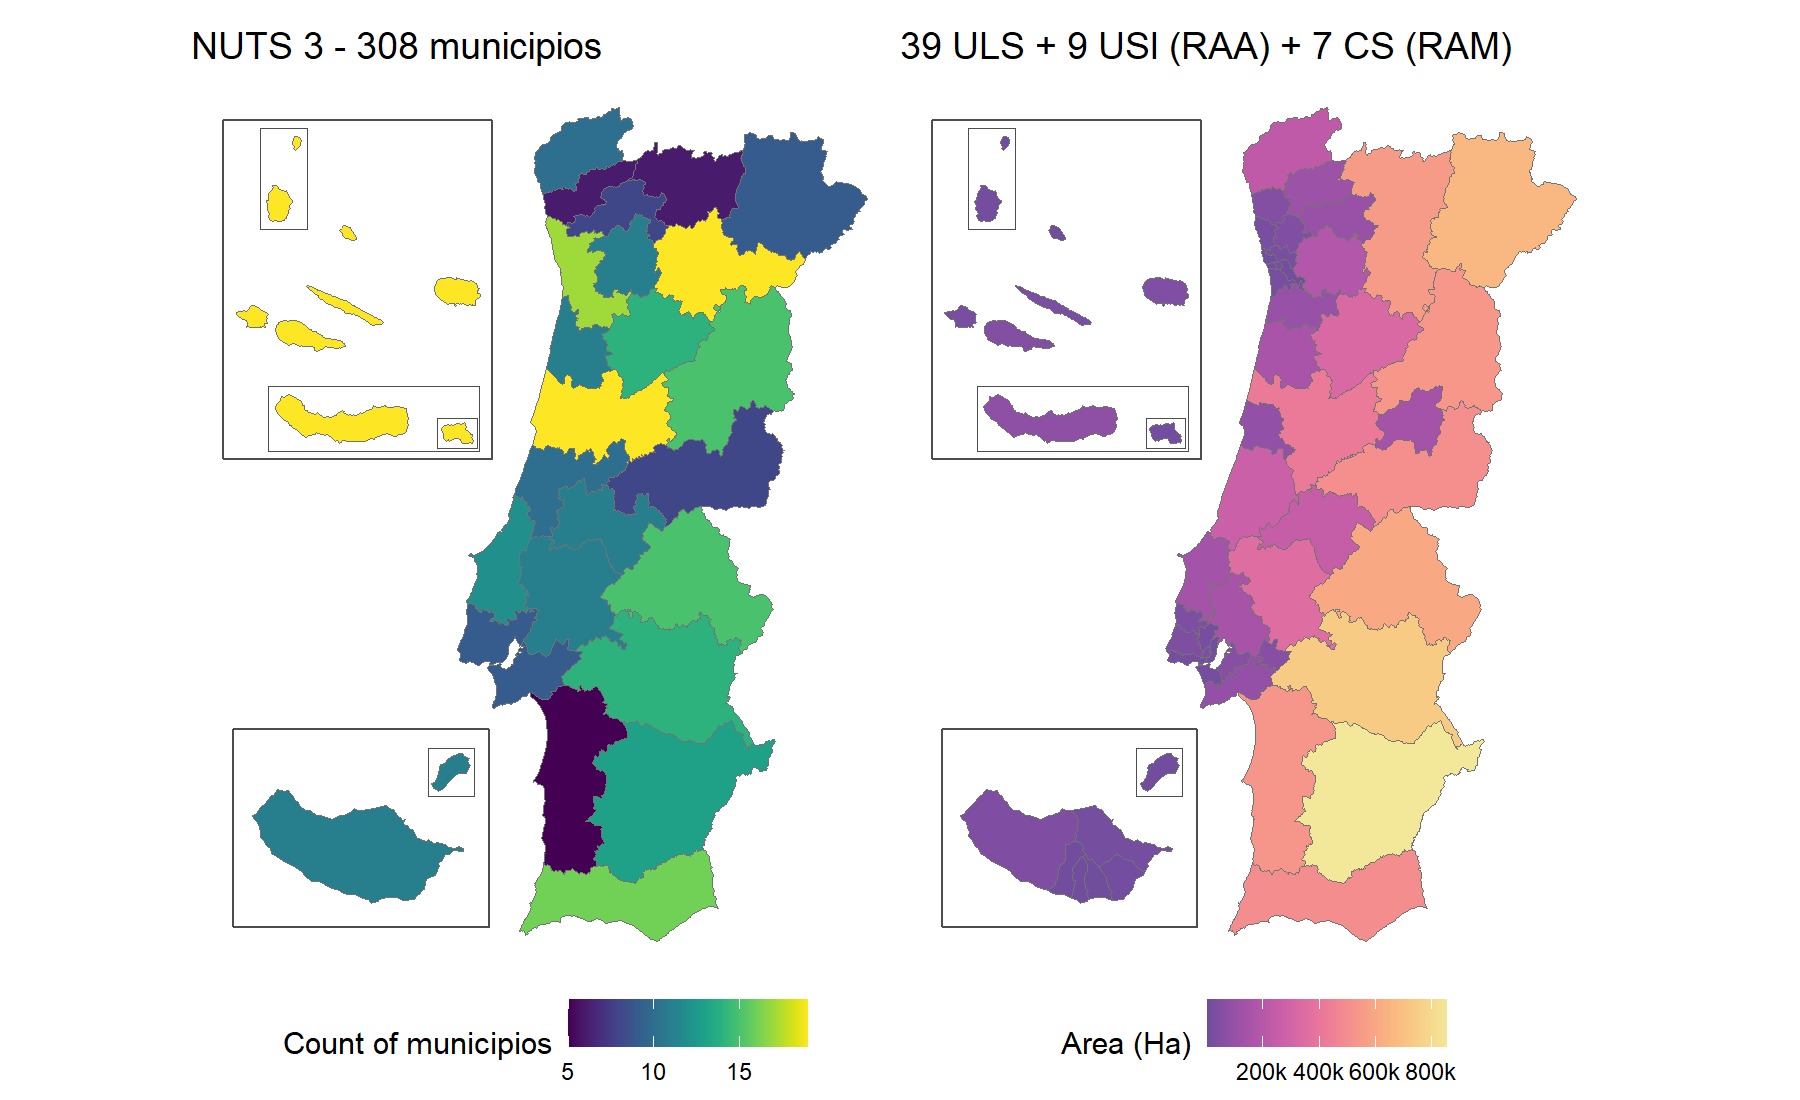
# From CRAN
install.packages("geopt")

# From GitHub
# install.packages("pak")
pak::pak("c-matos/geopt")library(geopt)
# Custom data
df <- data.frame(
concelho = c("PORTO", "Lisboa", "golega", "Faro", "Lagoa (RAA)", "Calheta (RAM)"),
score = c(10, 25, 15, 8, 18, 12)
)
# Plot a map
plot_pt(df, value = "score", by = c(municipio = "concelho"))
#> get_map: 302 boundaries have no data row (NA fill).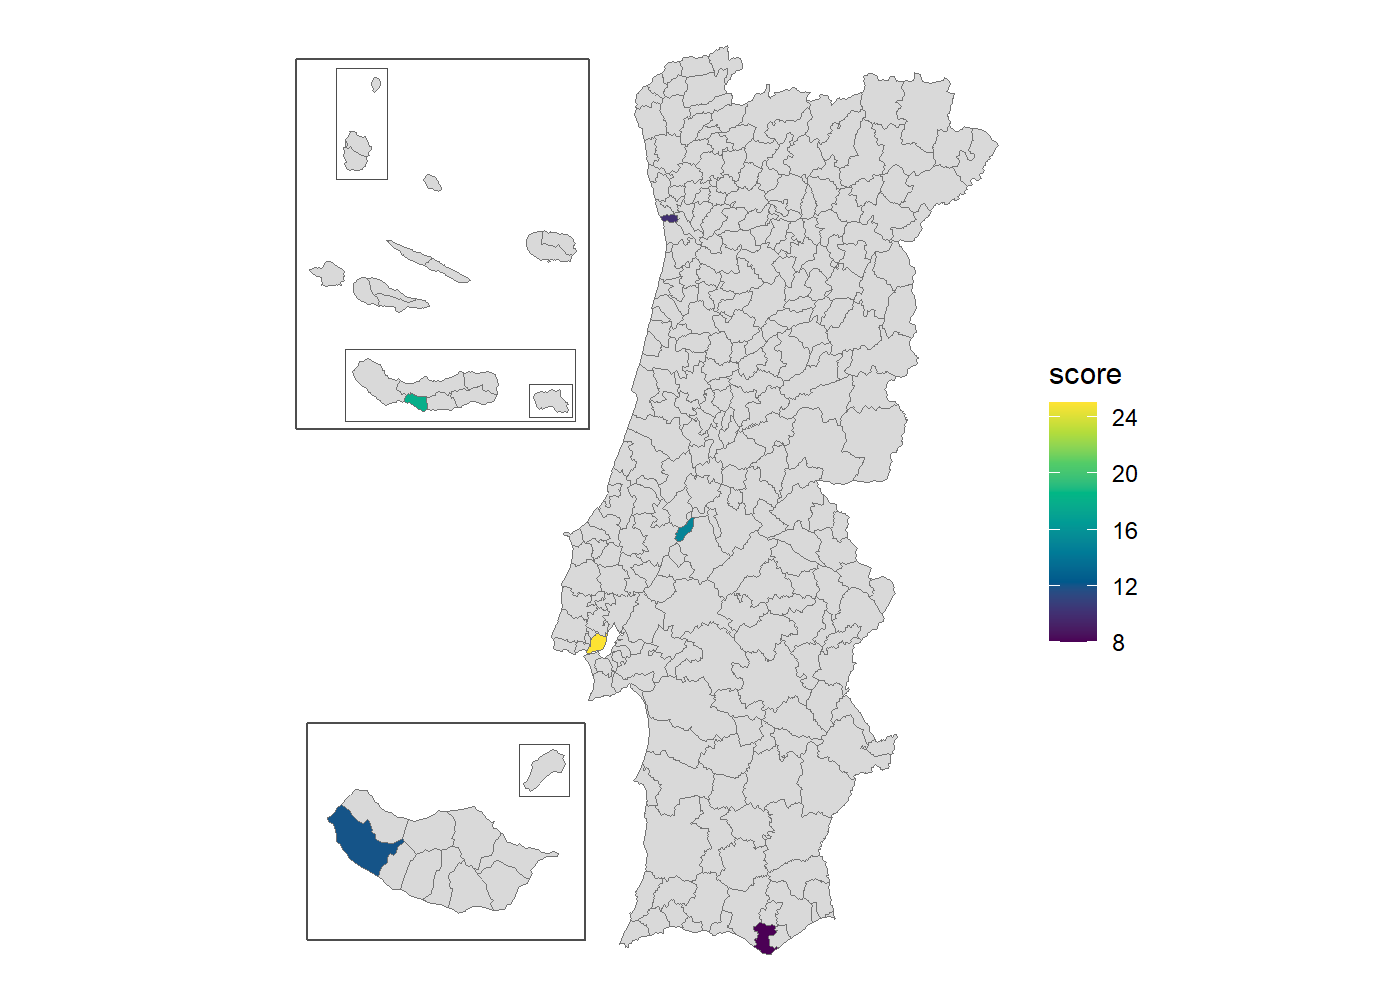
Add renderer = "echarts" for an interactive htmlwidget
instead.
plot_pt(df, value = "score", by = c(municipio = "concelho"), renderer = "echarts")Start with vignette("geopt"),
then pick the guide for the task at hand:
vignette("map-compositions")vignette("joining-data")vignette("health-geographies")vignette("vintages")vignette("downloading-data")Curious how it works? The website has articles on how the bundled data is built and how name matching works.
get_censos(), not bundled.?pt_nuts_codes and ?pt_health_codes.geopt is not affiliated with DGT or INE.
AI was used in the development of this package. Claude (Anthropic), specifically Claude Opus 4.8, Opus 5 and Opus 5.5, assisted with writing code, tests and documentation.
MIT © Carlos Matos
These binaries (installable software) and packages are in development.
They may not be fully stable and should be used with caution. We make no claims about them.
Health stats visible at Monitor.