The hardware and bandwidth for this mirror is donated by dogado GmbH, the Webhosting and Full Service-Cloud Provider. Check out our Wordpress Tutorial.
If you wish to report a bug, or if you are interested in having us mirror your free-software or open-source project, please feel free to contact us at mirror[@]dogado.de.
![]()
![]()
The goal of {geoprofiler} is to get distances along and
across user-defined profile lines or transects. This is useful to
visualize the distance-dependency of some variables in the
geosciences.
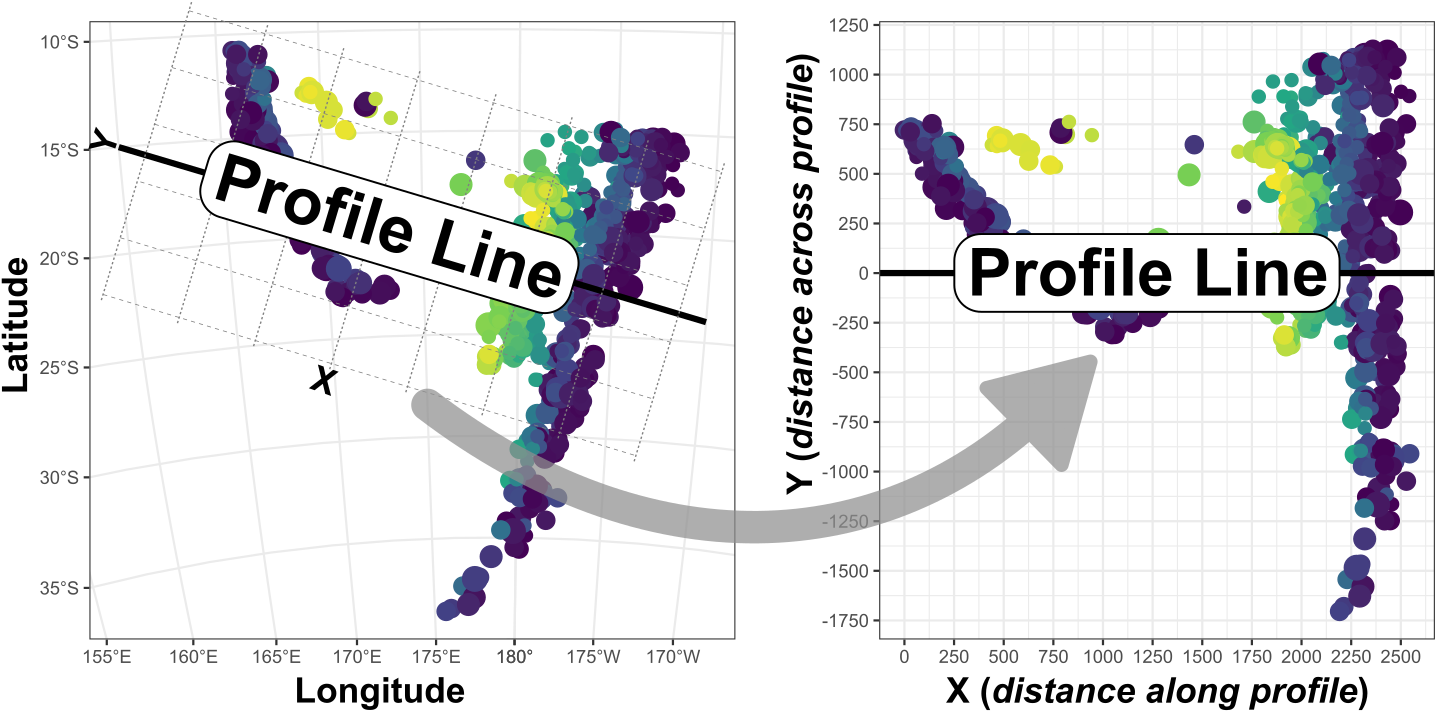
The concept of {geoprofiler} is a coordinate
transformation of your geo-coordinates into “profile coordinates”. These
coordinates are the distances along and across your profile.
You must have R installed on your system (see https://www.r-project.org/). To install
{geoprofiler} from CRAN, type the following code at the R
command line prompt:
install.packages("geoprofiler")The most recent development version of {geoprofiler} is
available from from GitHub and can be
installed on your system as follows:
# install.packages("devtools")
devtools::install_github("tobiste/geoprofiler")This is a basic example which shows you how to create a profile.
library(geoprofiler)
library(ggplot2)
#> Warning: package 'ggplot2' was built under R version 4.3.3
Import example data and transfer them into a sf
object:
data(quakes)
quakes_sf <- sf::st_as_sf(quakes, coords = c("long", "lat"), crs = "WGS84")
Create a profile line from two known points:
profile <- data.frame(lon = c(160, -170), lat = c(-15, -30)) |>
  sf::st_as_sf(coords = c("lon", "lat"), crs = "WGS84") |>
  sf::st_shift_longitude() |>
  profile_line()
Note: You can also create a profile line by a direction via
profile_points()
Calculate the distances of all points along and across the profile line:
quakes_profile <- profile_coords(quakes_sf, profile = profile) |>
  dplyr::bind_cols(quakes_sf)
Finally, create your profile plot:
ggplot(quakes_profile, aes(X, depth, color = mag, size = abs(Y), alpha = abs(Y))) +
  geom_point() +
  scale_color_viridis_c("Richter magnitude", option = "A") +
  scale_size_continuous(bquote("Distance from profile (" * degree * ")"), range = c(3, .1)) +
  scale_alpha_continuous(bquote("Distance from profile (" * degree * ")"), range = c(1, .1)) +
  scale_y_reverse() +
  scale_x_continuous(guide = guide_axis(position = "top")) +
  labs(x = bquote("Distance along profile (" * degree * ")"), y = "Depth (km)") +
  theme_classic()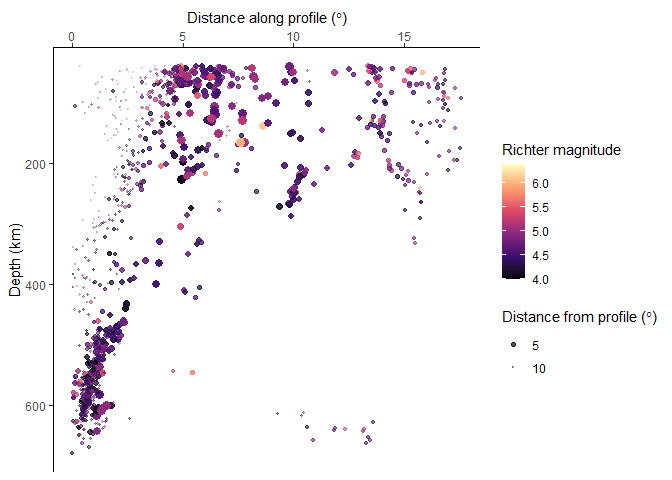
The above example uses the quakes dataset giving the
locations of 1000 seismic events of MB > 4.0. The events occurred in
a cube near Fiji since 1964.
The detailed documentation can be found at https://tobiste.github.io/geoprofiler/articles/geoprofiler.html
Tobias Stephan (tstephan@lakeheadu.ca)
I welcome feedback, suggestions, issues, and contributions! If you have found a bug, please file it here with minimal code to reproduce the issue.
When referencing this package, please cite the package DOI: 10.32614/CRAN.package.geoprofiler.
GPL-3.0 License
These binaries (installable software) and packages are in development.
They may not be fully stable and should be used with caution. We make no claims about them.
Health stats visible at Monitor.