The hardware and bandwidth for this mirror is donated by dogado GmbH, the Webhosting and Full Service-Cloud Provider. Check out our Wordpress Tutorial.
If you wish to report a bug, or if you are interested in having us mirror your free-software or open-source project, please feel free to contact us at mirror[@]dogado.de.
![]()
![]()
![]()
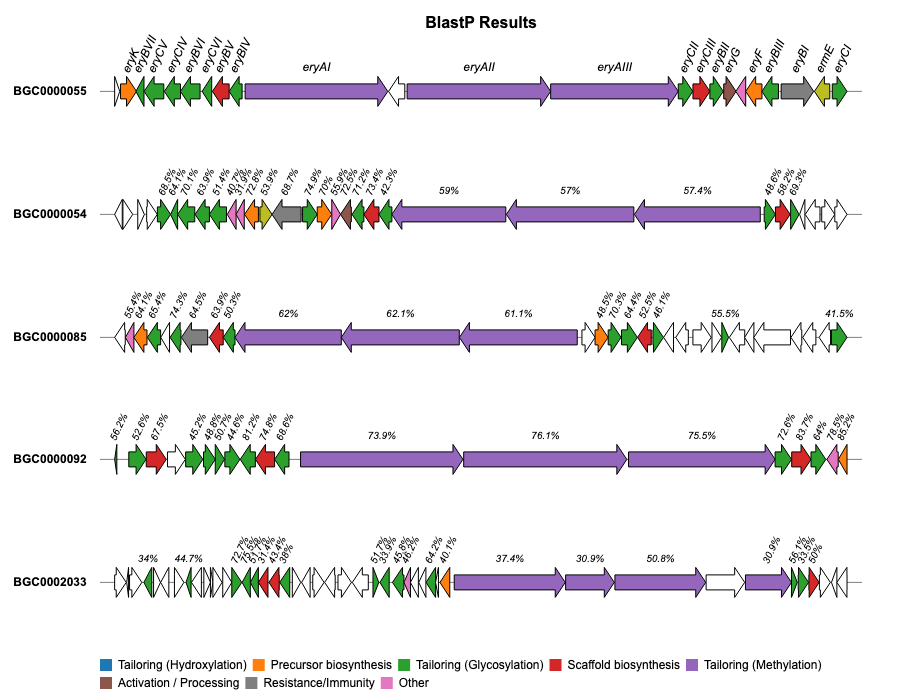
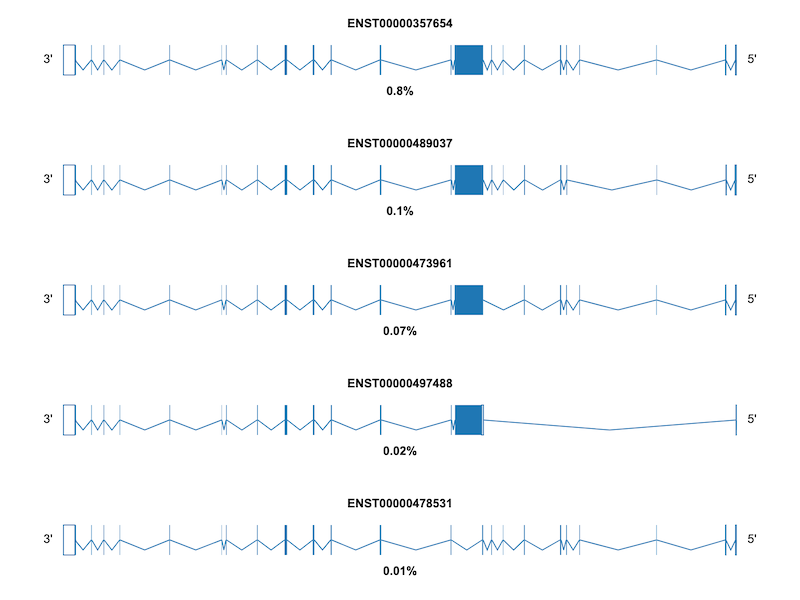
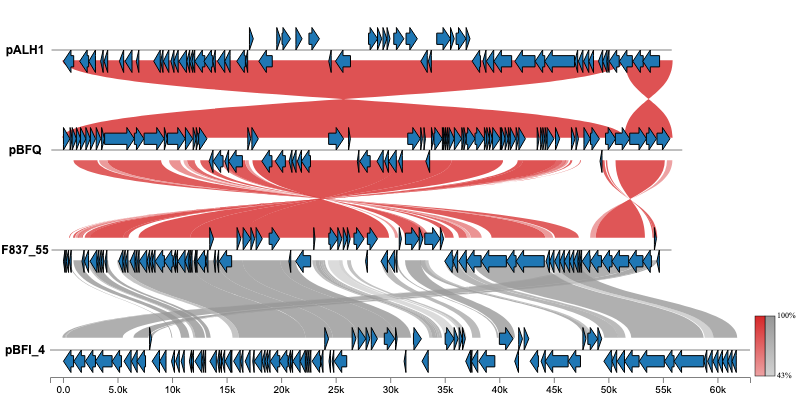
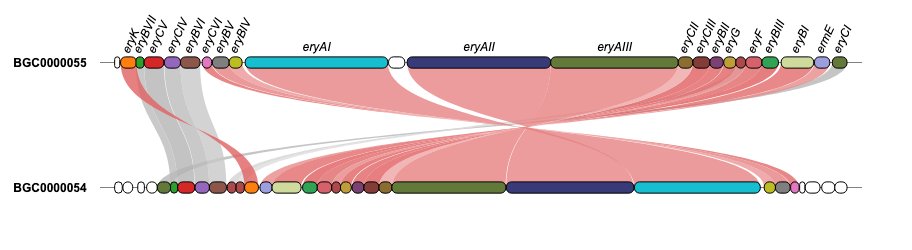
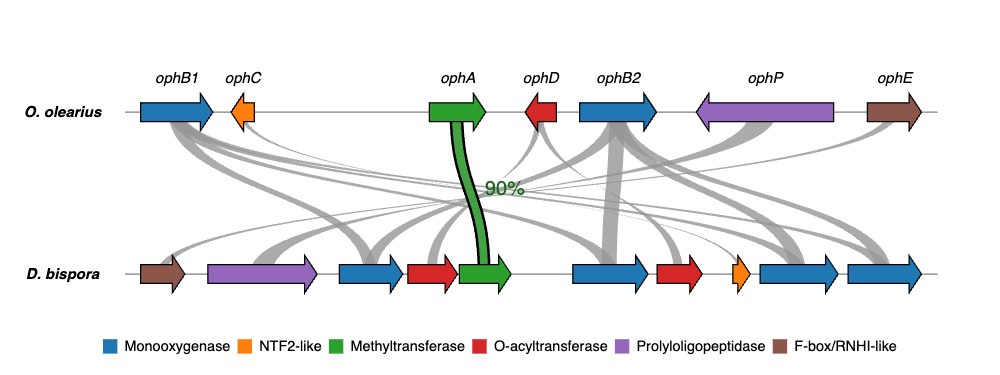
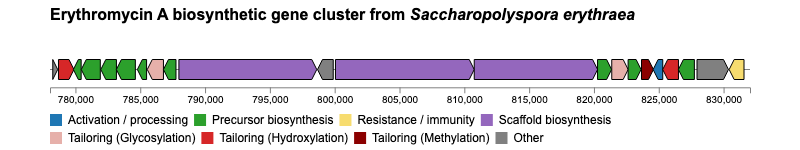
geneviewer is an R package for plotting gene clusters and transcripts. It imports data from GenBank, FASTA, and GFF files, performs BlastP and MUMmer alignments, and displays results on gene arrow maps. The package offers extensive customization options, including legends, labels, annotations, scales, colors, tooltips, and more. To explore all features visit the package website.
Try the Gene Cluster Dashboard - a web interface that provides point-and-click access to geneviewer’s visualization features. (Allow 1-2 minutes for loading)
You can install the released version of geneviewer from CRAN with:
install.packages("geneviewer")And the development version from GitHub with:
# install.packages("devtools")
devtools::install_github("nvelden/geneviewer")The below example demonstrates using geneviewer to
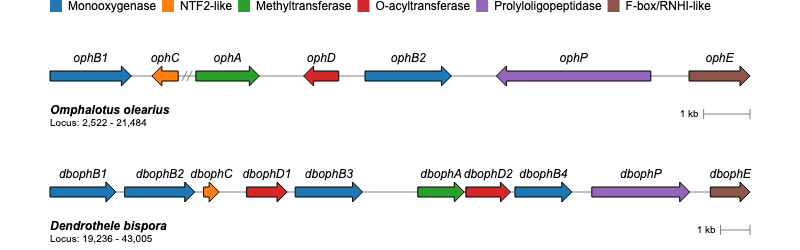
plot a gene cluster on a genomic sequence, using the start and end
positions of each gene. The genes are grouped by class and labels are
added using the GC_labels function.
library(geneviewer)

# Data
gene_cluster <- data.frame(
  name = c("ophB1", "ophC", "ophA", "ophD", "ophB2", "ophP", "ophE"),
  start = c(2522, 5286, 9536, 12616, 13183, 19346, 20170),
  end = c(4276, 4718, 10904, 11859, 15046, 16016, 21484),
  class = c("Monooxygenase", "NTF2-like", "Methyltransferase",
  "O-acyltransferase", "Monooxygenase", "Prolyloligopeptidase",
  "F-box/RNHI-like")
)

# Chart
GC_chart(gene_cluster, group = "class", height = "100px") %>%
  GC_labels("name")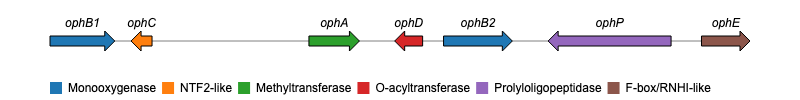
For additional examples and the corresponding code to create the plots, please visit the Examples section.
If you encounter any issues or have feature requests, please open an Issue.
These binaries (installable software) and packages are in development.
They may not be fully stable and should be used with caution. We make no claims about them.
Health stats visible at Monitor.