The hardware and bandwidth for this mirror is donated by dogado GmbH, the Webhosting and Full Service-Cloud Provider. Check out our Wordpress Tutorial.
If you wish to report a bug, or if you are interested in having us mirror your free-software or open-source project, please feel free to contact us at mirror[@]dogado.de.
Wajid Jawaid 2021-02-03
gatepoints can be installed from Github or through CRAN.
library(devtools)
install_github("wjawaid/gatepoints")The package can be downloaded from CRAN using:
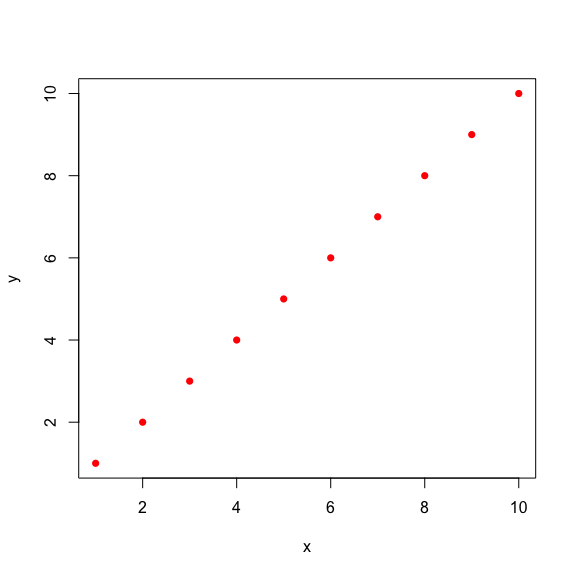
install.packages("gatepoints")gatepoints provides an easy to use function, fhs (freehand select) for gating or selecting points freehand on a plot. If using from RStudio please use X11 display for a better user experience. Take the simple plot below:
x <- data.frame(x=1:10, y=1:10, row.names = 1:10)
## If you are using RStudio do X11() first.
plot(x, pch = 16, col = "red")
library(gatepoints)
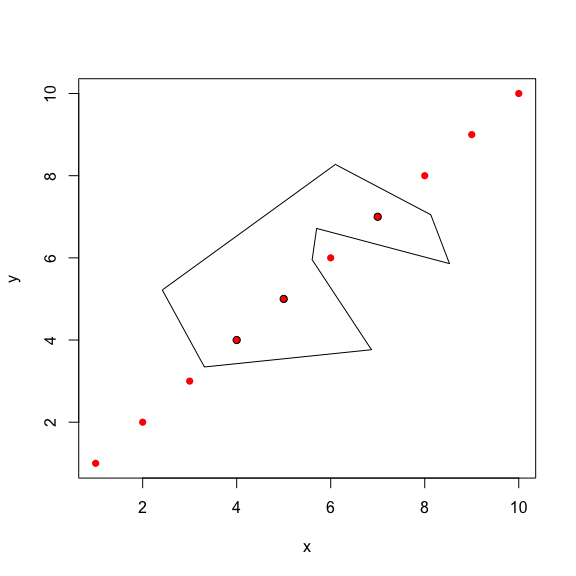
selectedPoints <- fhs(x, mark = TRUE)
To select an arbitrarily complex region run the above commands and proceed as follows:

The points can be marked as defined by the user with additional parameters passed to the points function. The names of the points as given by the rownames of the data frame x will be returned in selectedPoints. Additionally the points selected for the gate will be returned as the gate attribute.
selectedPoints
#> [1] "4" "5" "7"
#> attr(,"gate")
#>          x        y
#> 1 6.099191 8.274120
#> 2 8.129107 7.048649
#> 3 8.526881 5.859404
#> 4 5.700760 6.716428
#> 5 5.605314 5.953430
#> 6 6.866882 3.764390
#> 7 3.313575 3.344069
#> 8 2.417270 5.217868
These binaries (installable software) and packages are in development.
They may not be fully stable and should be used with caution. We make no claims about them.
Health stats visible at Monitor.