
The hardware and bandwidth for this mirror is donated by dogado GmbH, the Webhosting and Full Service-Cloud Provider. Check out our Wordpress Tutorial.
If you wish to report a bug, or if you are interested in having us mirror your free-software or open-source project, please feel free to contact us at mirror[@]dogado.de.
![]()
flowTraceR is an R package for enabling researchers to perform inter-software comparisons for common proteomic software tools. It can be used to analyze label-free mass spectrometry-based experiments with data-dependent or data-independent spectral acquisition.
Install the development version from GitHub using the devtools
package by using the following commands:
# install.packages("devtools") #remove "#" if you do not have devtools package installed yet
devtools::install_github("OKdll/flowTraceR", dependencies = TRUE) # use dependencies TRUE to install all required packages for flowTraceRAs input the standard outputs of ProteomeDiscoverer, Spectronaut, DIA-NN or MaxQuant are supported by flowTraceR. Details about further requirements are listed in the vignette Requirements.
Importing the output files from each software can be easily performed
with data.table::fread().
diann <- data.table::fread("DIRECTORY/dia-nn_file.tsv")
spectronaut <- data.table::fread("DIRECTORY/spectronaut_file.tsv")
mq_evidence <- data.table::fread("DIRECTORY/maxquant_evidence.txt")
mq_proteinGroups <- data.table::fread("DIRECTORY/maxquant_proteinGroups.txt")
pd_psm <- data.table::fread("DIRECTORY/pd_PSMs.txt")#load libraries
library(flowTraceR)
library(magrittr)
library(dplyr)
library(tidyr)
library(stringr)
library(tibble)
library(ggplot2)
library(data.table)
library(kableExtra)This is a basic example which demonstrates how to trace inter-software differences in proteinGroup denotations for common precursor identifications. Please check the vignette Workflow for a detailed analysis pipeline and more functionalities.
#DIA-NN
diann <- get_example("DIA-NN")
#Spectronaut
spectronaut <- get_example("Spectronaut")

#convert to standardized format
diann_all_converted <- convert_all_levels(input_df = diann, software = "DIA-NN")
spectronaut_all_converted <- convert_all_levels(input_df = spectronaut, software = "Spectronaut")

#trace identifications in binary comparison
traced_all <- trace_all_levels(input_df1 = diann_all_converted, input_df2 = spectronaut_all_converted, analysis_name1 = "DIA-NN", analysis_name2 = "Spectronaut", filter_unknown_mods = TRUE)

#connect traced levels - proteinGroups_precursor
DIANN_connected_proteinGroup <- connect_traceR_levels(input_df = traced_all[["DIA-NN"]], level = "proteinGroups")
Spectronaut_connected_proteinGroup <- connect_traceR_levels(input_df = traced_all[["Spectronaut"]], level = "proteinGroups")

#trace differences in proteinGroup dentotation for common precursor identification
Difference_proteinGroup <- trace_unique_common_pg(input_df1 = DIANN_connected_proteinGroup, input_df2 = Spectronaut_connected_proteinGroup, analysis_name1 = "DIA-NN", analysis_name2 = "Spectronaut", string_analysis = TRUE)
The table shows differences of proteingroup denotations for common
precursor (traceR_precursor) for DIA-NN
(traceR_proteinGroups_DIA-NN) and Spectronaut
(traceR_proteinGroups_Spectronaut).
kableExtra::kable(Difference_proteinGroup, format = "pipe", caption = "Difference in proteinGroup denotation")| traceR_proteinGroups_DIA-NN | traceR_precursor | traceR_proteinGroups_Spectronaut |
|---|---|---|
| P01764 | AEDTAVYYC(UniMod:4)AK2 | A0A0J9YY99 |
| Q92496 | EGIVEYPR2 | Q02985 |
Difference in proteinGroup denotation
This is a basic example which shows the power of flowTraceR´s conversion to a standardized level (precursor, modified peptides, proteinGroup) output by highlighting an inter-software comparison of retention times. Please check the vignette Example_RT_distribution for a detailed view of the analysis with flowTraceR and without flowTraceR.
#DIA-NN
diann <- get_example("RetentionTime")[["DIA-NN"]]
#Spectronaut
spectronaut <- get_example("RetentionTime")[["Spectronaut"]]

#flowTraceR - Conversion
diann_all_converted <- convert_all_levels(input_df = diann, software = "DIA-NN")
spectronaut_all_converted <- convert_all_levels(input_df = spectronaut, software = "Spectronaut")

#Get common entries
diann_common_traceR <- dplyr::semi_join(
  diann_all_converted,
  spectronaut_all_converted,
  by = c("traceR_precursor"))

spectronaut_common_traceR <- dplyr::semi_join(
  spectronaut_all_converted,
  diann_all_converted,
  by = c("traceR_precursor")) %>%
  dplyr::rename(RT = EG.ApexRT)

#Combine
RT_common <- dplyr::bind_rows(
  "DIA-NN" = diann_common_traceR[,"RT"],
  Spectronaut = spectronaut_common_traceR[, "RT"],
  .id = "Software")

#Plot
ggplot2::ggplot(RT_common, aes(x = RT, color = Software)) +
  geom_density()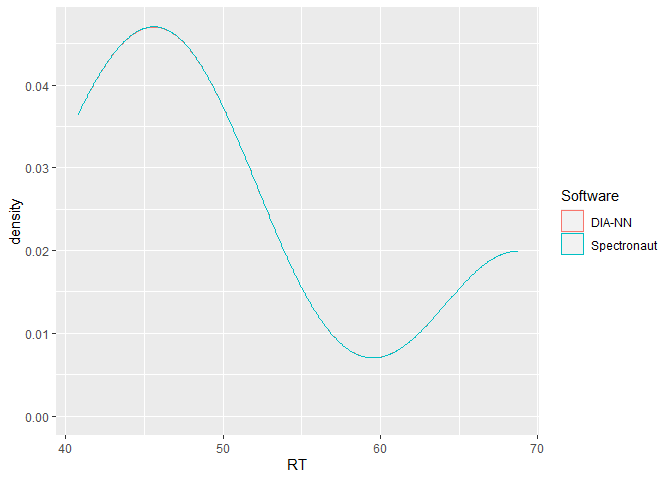
These binaries (installable software) and packages are in development.
They may not be fully stable and should be used with caution. We make no claims about them.
Health stats visible at Monitor.