
The hardware and bandwidth for this mirror is donated by dogado GmbH, the Webhosting and Full Service-Cloud Provider. Check out our Wordpress Tutorial.
If you wish to report a bug, or if you are interested in having us mirror your free-software or open-source project, please feel free to contact us at mirror[@]dogado.de.
![]()

The finalfit package provides functions that help you
quickly create elegant final results tables and plots when modelling in
R. These can easily be exported as Word documents, PDFs, or html
files.
Its design follows Hadley Wickham’s tidy tool manifesto.
In addition, it provides functions for identifying and handling missing data, together with a number of functions to bootstrap simulate regression model results.
You can install finalfit from CRAN:
install.packages("finalfit")It is recommended that this package is used together with
dplyr which can be installed via:
install.packages("dplyr")The package documentation is maintained independently at finalfit.org.
See Get started and the All tables vignettes for extensive examples.
# Crosstable
explanatory = c("age.factor", "sex.factor", "obstruct.factor")
dependent = 'mort_5yr'
colon_s %>%
  summary_factorlist(dependent, explanatory,
  p=TRUE, add_dependent_label=TRUE) -> t1
knitr::kable(t1, align=c("l", "l", "r", "r", "r"))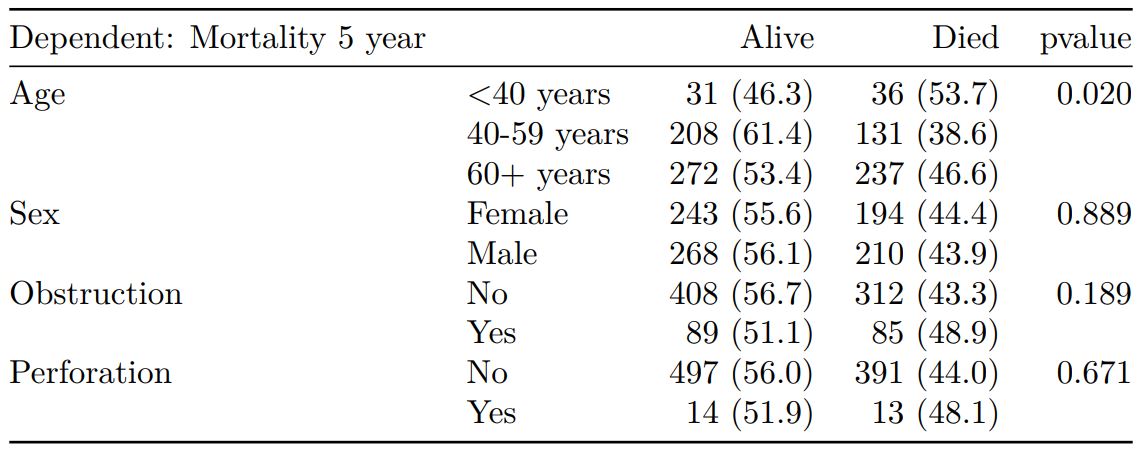
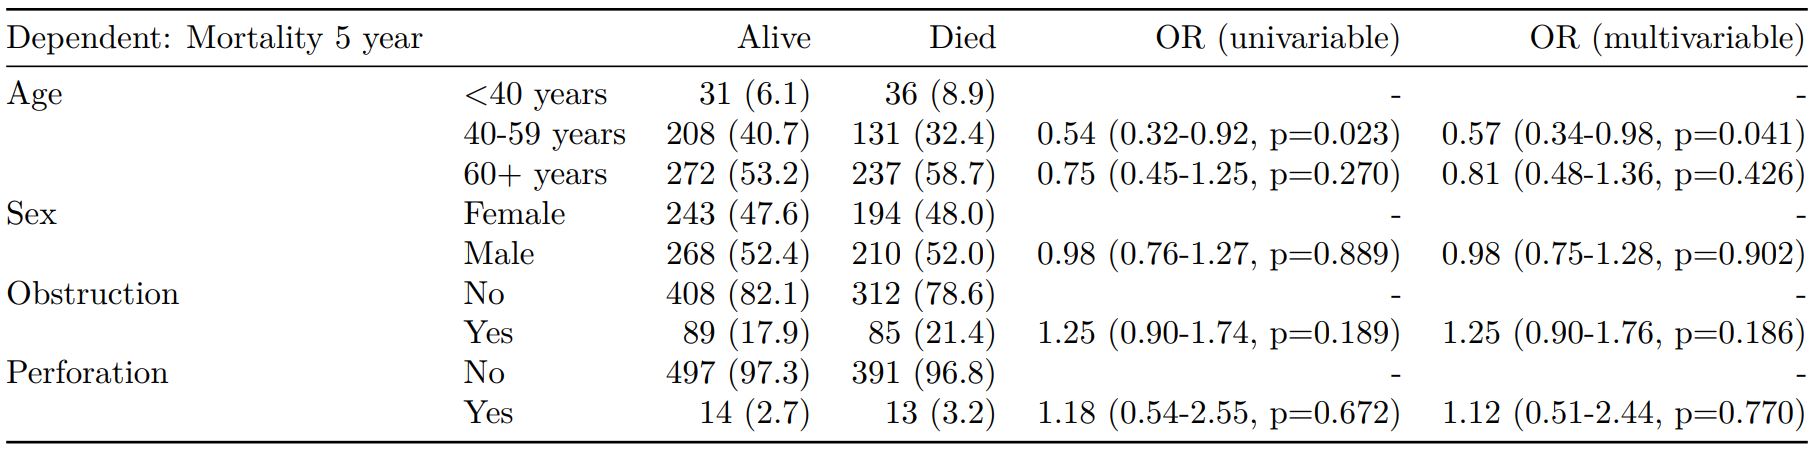
explanatory = c("age.factor", "sex.factor",
  "obstruct.factor", "perfor.factor")
dependent = 'mort_5yr'
colon_s %>%
  finalfit(dependent, explanatory, metrics=TRUE) -> t2
knitr::kable(t2[[1]], row.names=FALSE, align=c("l", "l", "r", "r", "r", "r"))
knitr::kable(t2[[2]], row.names=FALSE, col.names="")
When exported to PDF:

explanatory = c("age.factor", "sex.factor",
  "obstruct.factor", "perfor.factor")
dependent = 'mort_5yr'
colon_s %>%
  or_plot(dependent, explanatory)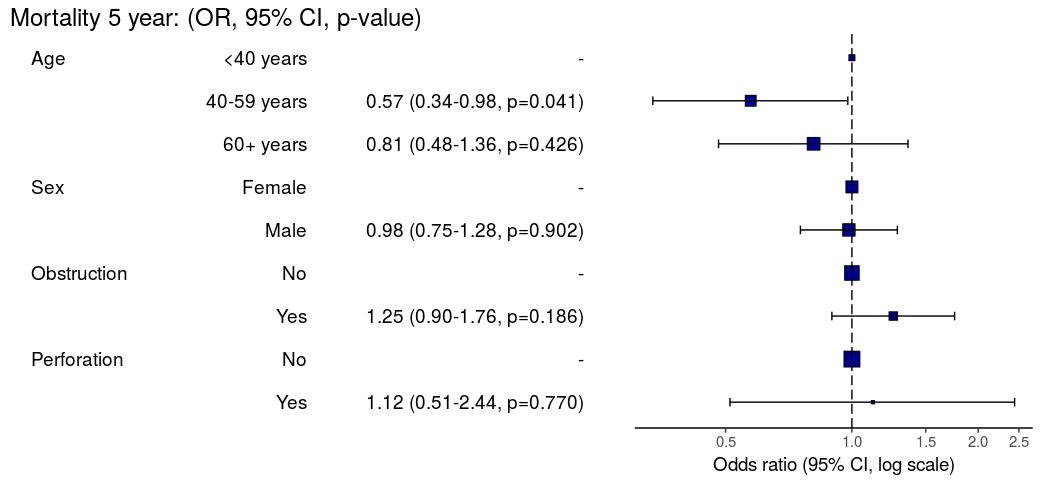
These binaries (installable software) and packages are in development.
They may not be fully stable and should be used with caution. We make no claims about them.
Health stats visible at Monitor.