The hardware and bandwidth for this mirror is donated by dogado GmbH, the Webhosting and Full Service-Cloud Provider. Check out our Wordpress Tutorial.
If you wish to report a bug, or if you are interested in having us mirror your free-software or open-source project, please feel free to contact us at mirror[@]dogado.de.
![]()
![]()
The goal of fahb is to help with clinical trial
feasibility assessment via
hierarchical Bayesian recruitment
models, fitted to (internal or external) pilot date. It can be used at
the design stage to optimise the pilot and any pre-specified decision
rules to guide progression, and at the analysis stage to produce a
probabilistic prediction of the time until the main trial recruits to
target.
Install the released version of fahb from CRAN:
install.packages("fahb")Or you can install the development version of fahb from
GitHub with:
# install.packages("devtools")
devtools::install_github("DTWilson/fahb")Suppose we are planning an internal pilot for a trial which aims to
recruit N = 320 participants from m = 20
sites, and that we expect recruitment to complete in three years. The
pilot analysis will happen at t = 0.5 years, and we would
class the trial as infeasible if recruitment took longer than
rel_thr = 1.2 times the expected recruitment time.
The variables N, m, t and rel_thr define
the design variables. For the model parameters, for the purpose of
illustration we use the package defaults (but see the vignette and the
associated paper for more discussion of these). To use fahb
we first encode all design variables and model parameters in a
fahb_problem object, then run some simulations via
forecast() before finding possible decision rules and the
operating characteristics they lead to:
library(fahb)

problem <- fahb_problem(N = 320, m = 20, t = 0.5, rel_thr = 1.2)

# Run the simulations
problem <- forecast(problem)

# Find some candidate decision rules are their OCs
design <- fahb_design(problem)

print(design)
#> Standard progression criteria
#>
#>     FPR        FNR         n_p          m_p        r_p
#> 1   0.0 0.82817058 17.81878829 -0.059458005  9.6590446
#> 11  0.1 0.45825809  9.57670582  1.334793215  6.6483566
#> 21  0.2 0.31559939  6.90517099  0.182386148  6.0045943
#> 41  0.4 0.18030282  1.59558082  0.759740721  5.6010379
#> 51  0.5 0.12835116  2.70338476  1.696370342  4.5998899
#> 71  0.7 0.05625781  0.14306472  0.904175281  3.5567570
#> 81  0.8 0.03681067 -0.30186503  0.937890251  2.8416713
#> 91  0.9 0.02222531 -0.90403448 -0.022824150  1.9307604
#> 101 1.0 0.00000000  0.01221748  0.008838253 -0.7620012
#>
#> Bayesian approximation
#>
#>     FPR        FNR      T_p
#> 1   0.0 1.00000000 1.441843
#> 11  0.1 0.42366995 3.123216
#> 21  0.2 0.31309904 3.298833
#> 41  0.4 0.16335602 3.594781
#> 51  0.5 0.11543270 3.721615
#> 71  0.7 0.05723017 3.916746
#> 81  0.8 0.03653285 4.001302
#> 91  0.9 0.02139186 4.085859
#> 101 1.0 0.00000000 4.554172
#>
#> FPR - False Positive Rate
#> FNR - False Negative Rate
#>
#> n_p, m_p, r_p - Probabilistic thresholds for standard
#>                 progression criteria on the number recruited,
#>                 number of sites opened, and the recruitment rate
#>                 (participants per site per year) respectively
#>
#> T_p - Bayesian decision rule threshold for the posterior predictive
#>       expected time until full recruitment
plot(design)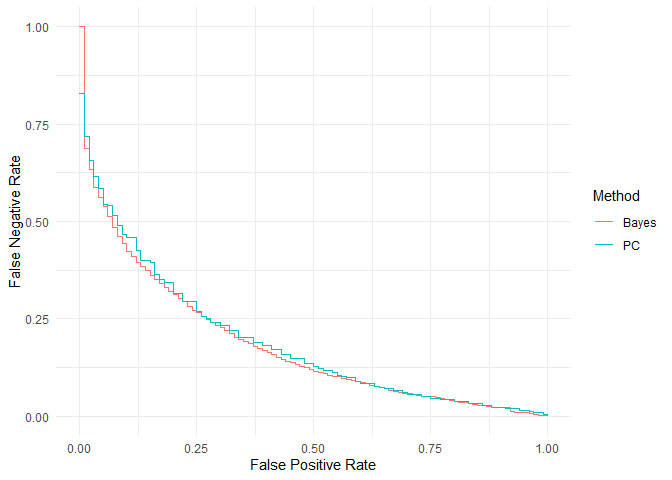
Two types of decision rules are considered here. Firstly, we consider
rules which take the same form as the standard progression criteria
suggested by the NIHR. In the table output, n_p is a
minimum number of participants recruited, m_p is a minimum
number of sites opened, and r_p is a minimum rate of
recruitment (participants per site-year), and we progress to the main
trial only if all of these thresholds are met.
The second type of decision rules is defined by T_p, the
maximum expected time until full recruitment conditional on the pilot
data. We progress to the main trial only if the actual posterior
predictive expectation is lower than this threshold.
Decision rules of both types are characterised by their false
positive (FPR) and false negative (FNR) rates.
These are estimated via simulation by comparing the decisions made with
the underlying feasibility, as determined by the threshold
rel_thr. For example, we can attain FPR = 0.15
and FNR = 0.34 if we proceed only if we recruit at least
\(10.48\) participants from at least
\(1\) site, with an overall rate of at
least \(6.57\) participants per
site-year. We can get slightly better operating characteristics if we
use a Bayesian progression rules instead. If we want to improve the
pilot further we can increase the design variable t_int so
that the internal pilot will have more data.
These binaries (installable software) and packages are in development.
They may not be fully stable and should be used with caution. We make no claims about them.
Health stats visible at Monitor.