


The hardware and bandwidth for this mirror is donated by dogado GmbH, the Webhosting and Full Service-Cloud Provider. Check out our Wordpress Tutorial.
If you wish to report a bug, or if you are interested in having us mirror your free-software or open-source project, please feel free to contact us at mirror[@]dogado.de.
The erplots package provides a mini-language for building exposure-response plots: model curves/ribbons, quantile-binned response-rate summaries, data strips, and grouped distribution panels. It supports time-to-event plots and visual predictive check plots as well as the core exposure-response plots, and it is model agnostic: it can display model predictions and summaries for a particular model type as long an appropriate model interface (consisting of a few key S3 methods) is available. Packages that support the interface include erglm (e.g., logistic regression, linear regression, Poisson regression, etc), ertte (parametric survival models, Cox proportional hazard models), and emaxnls (hyperbolic and sigmoidal Emax regression models for binary and continuous outcomes).
You can install the latest CRAN release like so:
install.packages("erplots")Alternatively, you can install the development version of erplots with this:
pak::pak("djnavarro/erplots")library(erplots)
library(erglm)
mod <- erglm_model(ae1 ~ aucss, erglm_data, family = binomial())
erglm_data |>
er_plot(aucss, ae1) |>
er_plot_add_model(mod) |>
er_plot_add_quantiles() |>
er_plot_add_groups(aucss) |>
plot()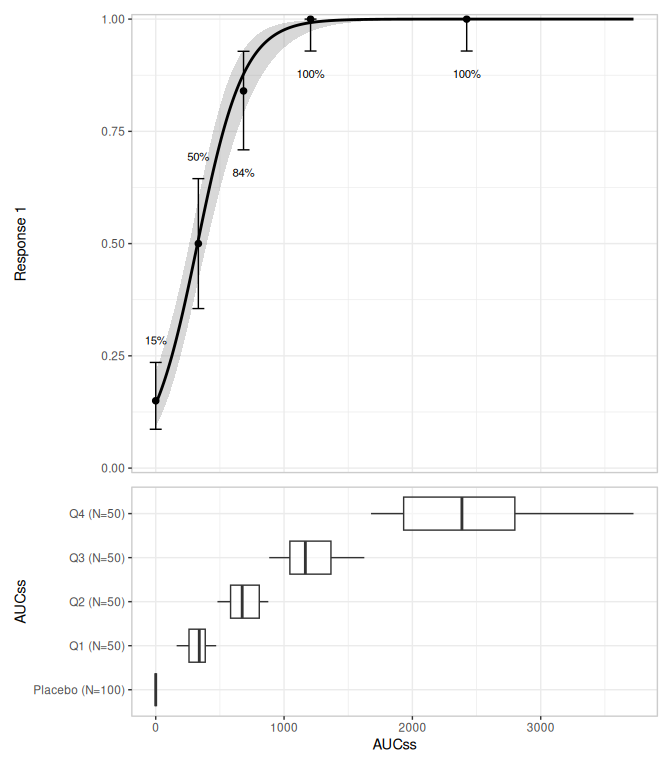
mod2 <- erglm_model(ae2 ~ aucss + sex, erglm_data, family = binomial())

plt <- erglm_data |>
   er_plot(aucss, ae2, stratify_by = sex) |>
   er_plot_add_model(mod2) |>
   er_plot_add_quantiles(bins = 3) |>
   er_plot_add_data() |>
   er_plot_add_groups(group_by = c(aucss, treatment), keep_strata = FALSE)

print(plt)
#> <er_plot>
#>   plot variables:
#>     - exposure:        aucss
#>     - response:        ae2
#>     - stratification:  sex
#>   plot layers:
#>     - model:           erglm_model/glm/lm
#>     - quantile:        3 bins
#>     - overlay:         stratified
#>     - group:           .aucss_quantile, treatment
#>   plots built: <none>
#>   output built: no
plot(plt)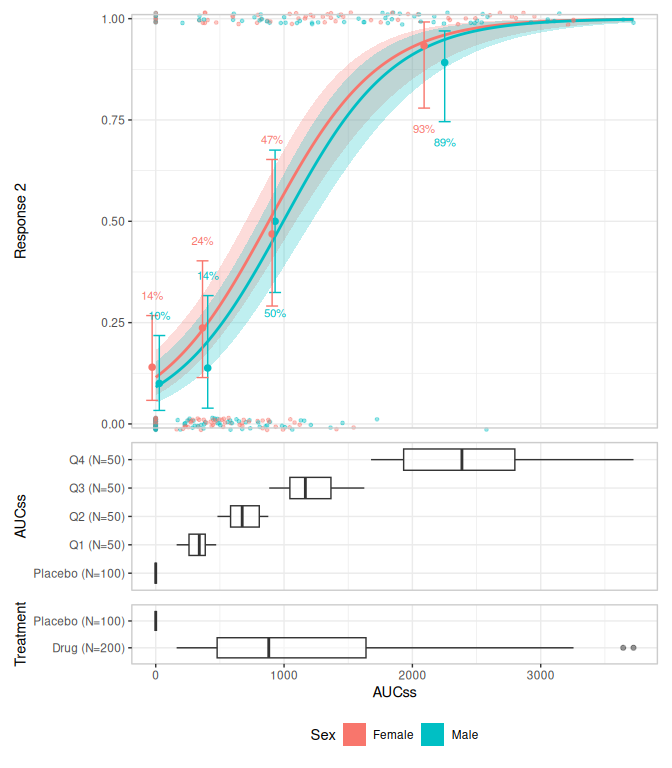
These binaries (installable software) and packages are in development.
They may not be fully stable and should be used with caution. We make no claims about them.
Health stats visible at Monitor.