The hardware and bandwidth for this mirror is donated by dogado GmbH, the Webhosting and Full Service-Cloud Provider. Check out our Wordpress Tutorial.
If you wish to report a bug, or if you are interested in having us mirror your free-software or open-source project, please feel free to contact us at mirror[@]dogado.de.


ekioplot implements EKIO’s visual identity system for
data visualization in R.
library(ekioplot)
library(ggplot2)

ggplot(mtcars, aes(wt, mpg, color = factor(cyl))) +
  geom_point(size = 3) +
  scale_color_ekio_d("full") +
  labs(
    title = "Fuel Efficiency vs. Weight",
    subtitle = "Motor Trend Car Road Tests (1974)",
    x = "Weight (1000 lbs)",
    y = "Miles per Gallon",
    color = "Cylinders"
  ) +
  theme_ekio()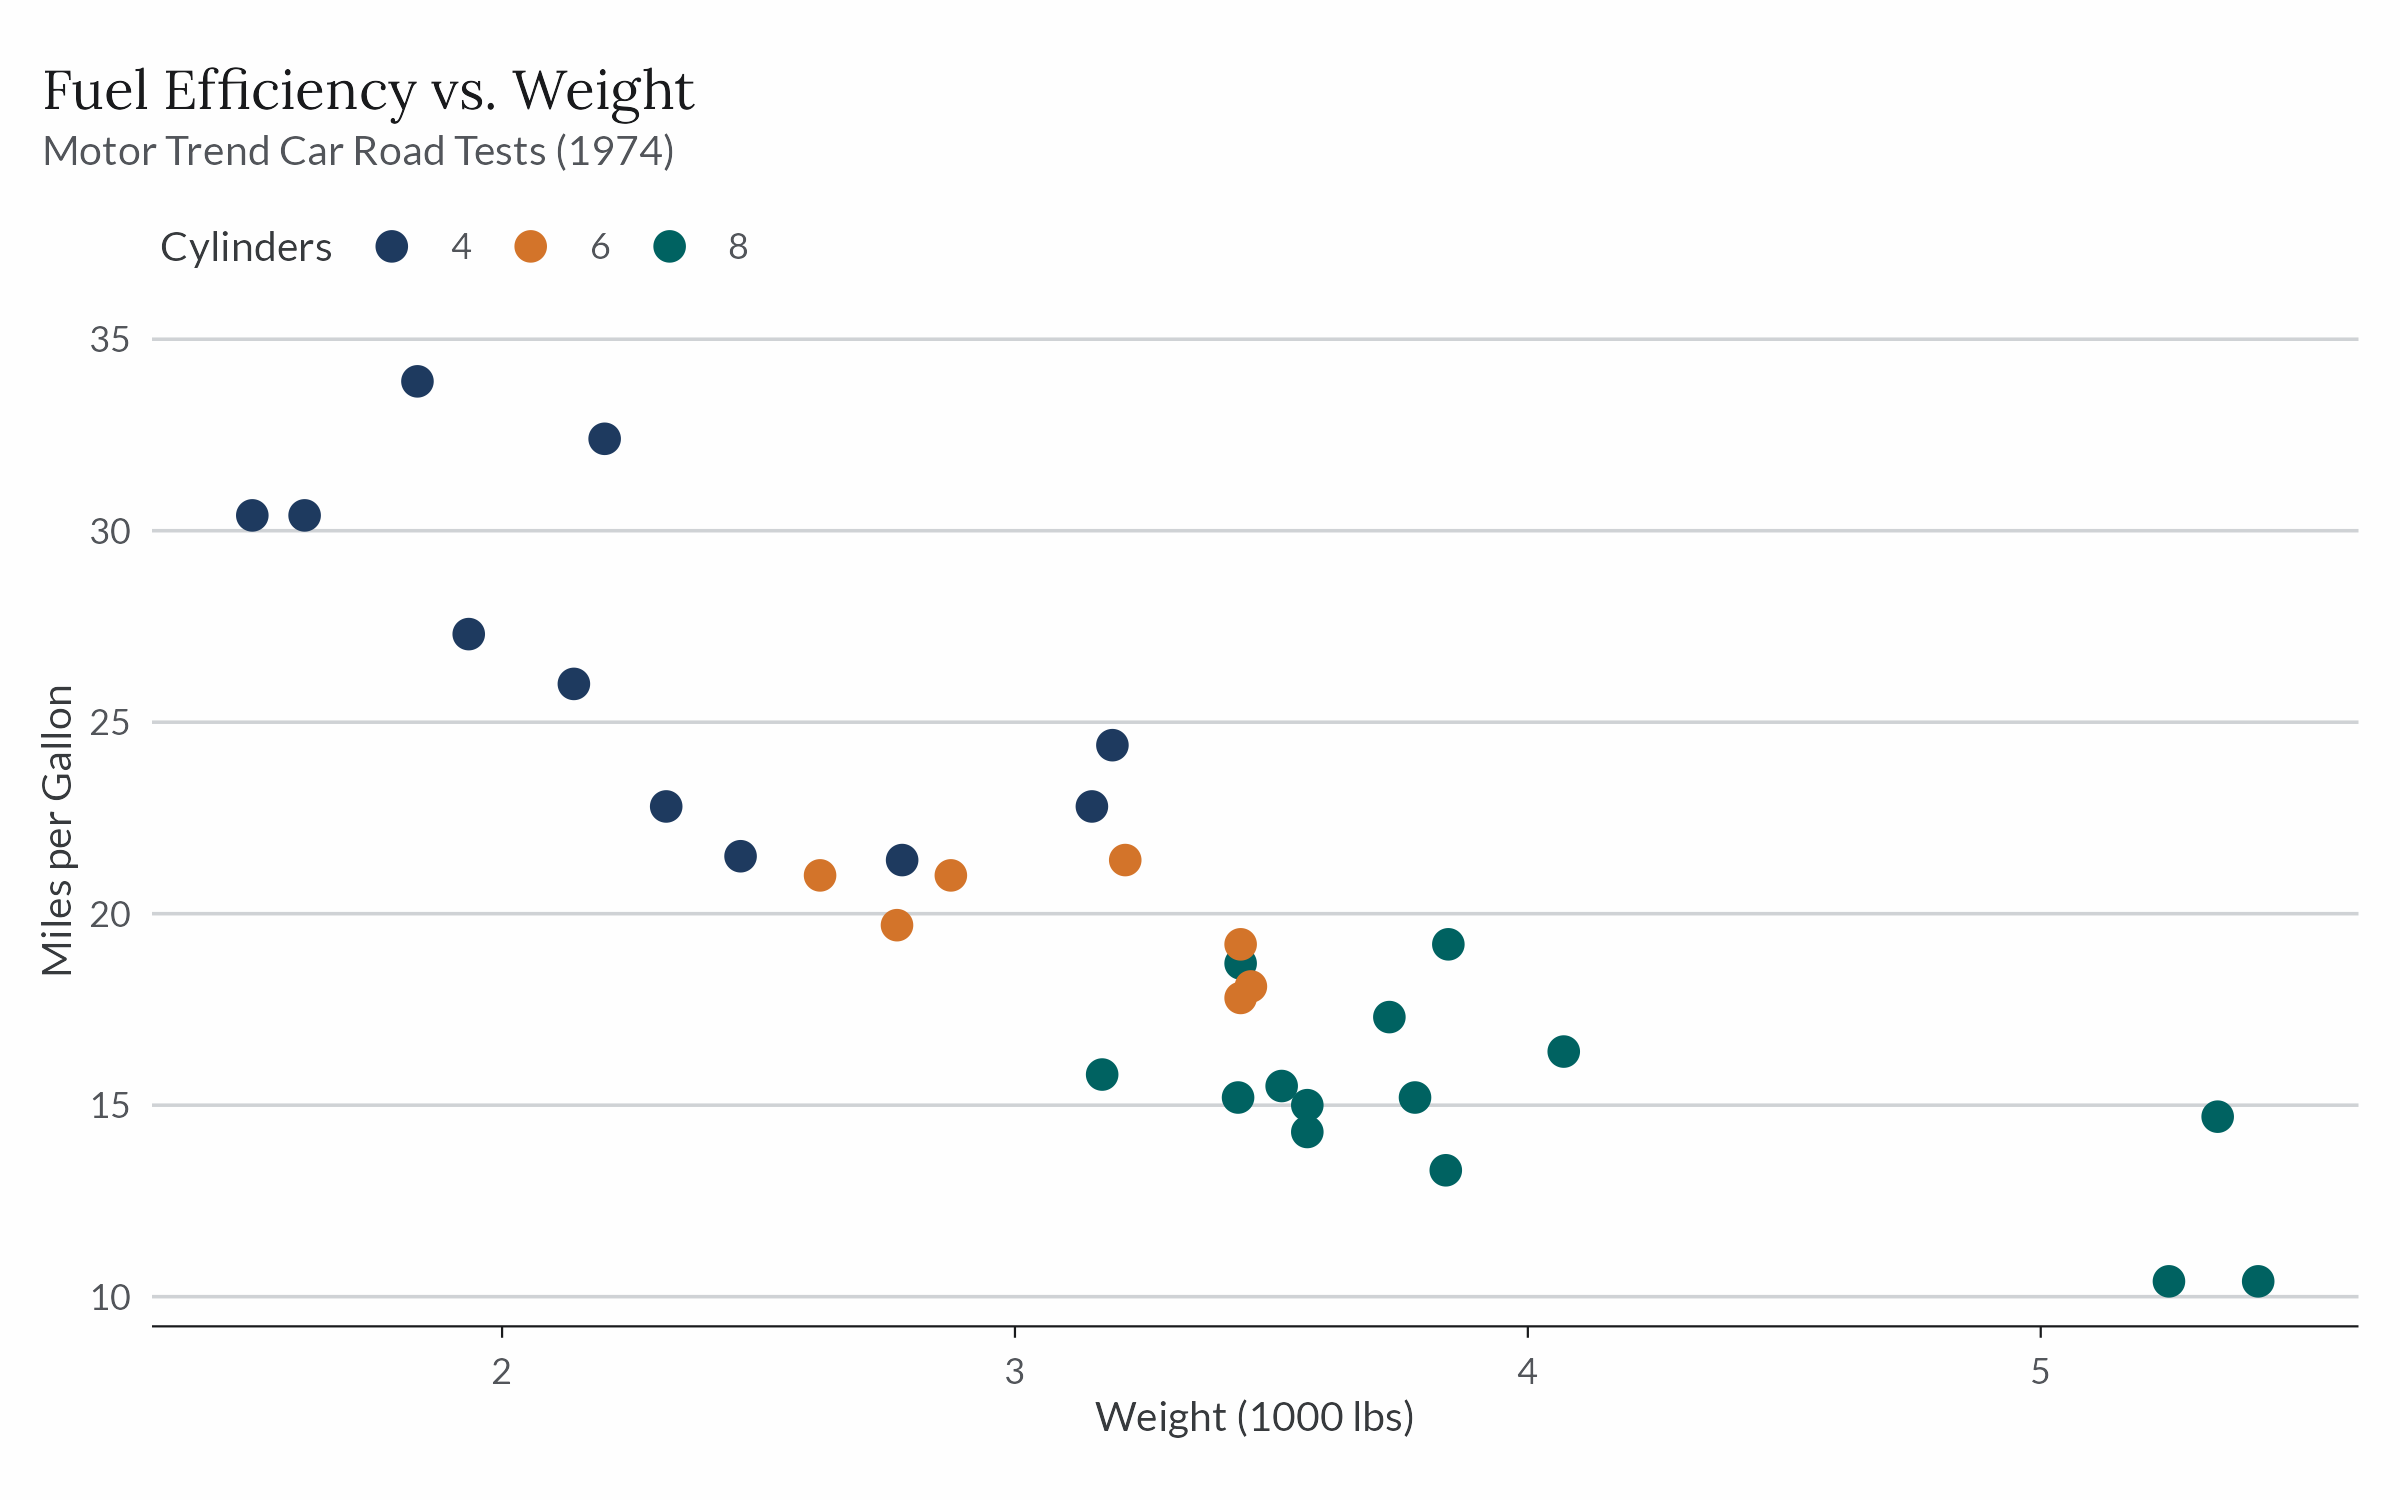
Install the released version from CRAN:
install.packages("ekioplot")Install the development version from r-universe:
install.packages(
  "ekioplot",
  repos = c(
    "https://viniciusoike.r-universe.dev",
    "https://cloud.r-project.org"
  )
)
Alternatively, install the development version from GitHub.
# install.packages("pak")
pak::pak("viniciusoike/ekioplot")theme_ekio() applies EKIO’s visual identity to any
ggplot2 plot, building on theme_minimal() with curated
typography, spacing, and color. The grid argument controls
which major grid lines are drawn ("y", "x",
"xy", or "none").
theme_ekio(grid = "xy")ekioplot ships palettes across five groups, all accessible through a single function. The seven brand scales are generated from one OKLCH specification, so a given shade carries the same visual weight in every family.
Compact categorical palettes ("cool3",
"cool4") cover small groups; "full_muted"
provides a quieter eight-color alternative. Variable-size accent
palettes keep blue or orange prominent against two to six series.
ekio_pal()
ekio_pal("accent_blue", n = 5)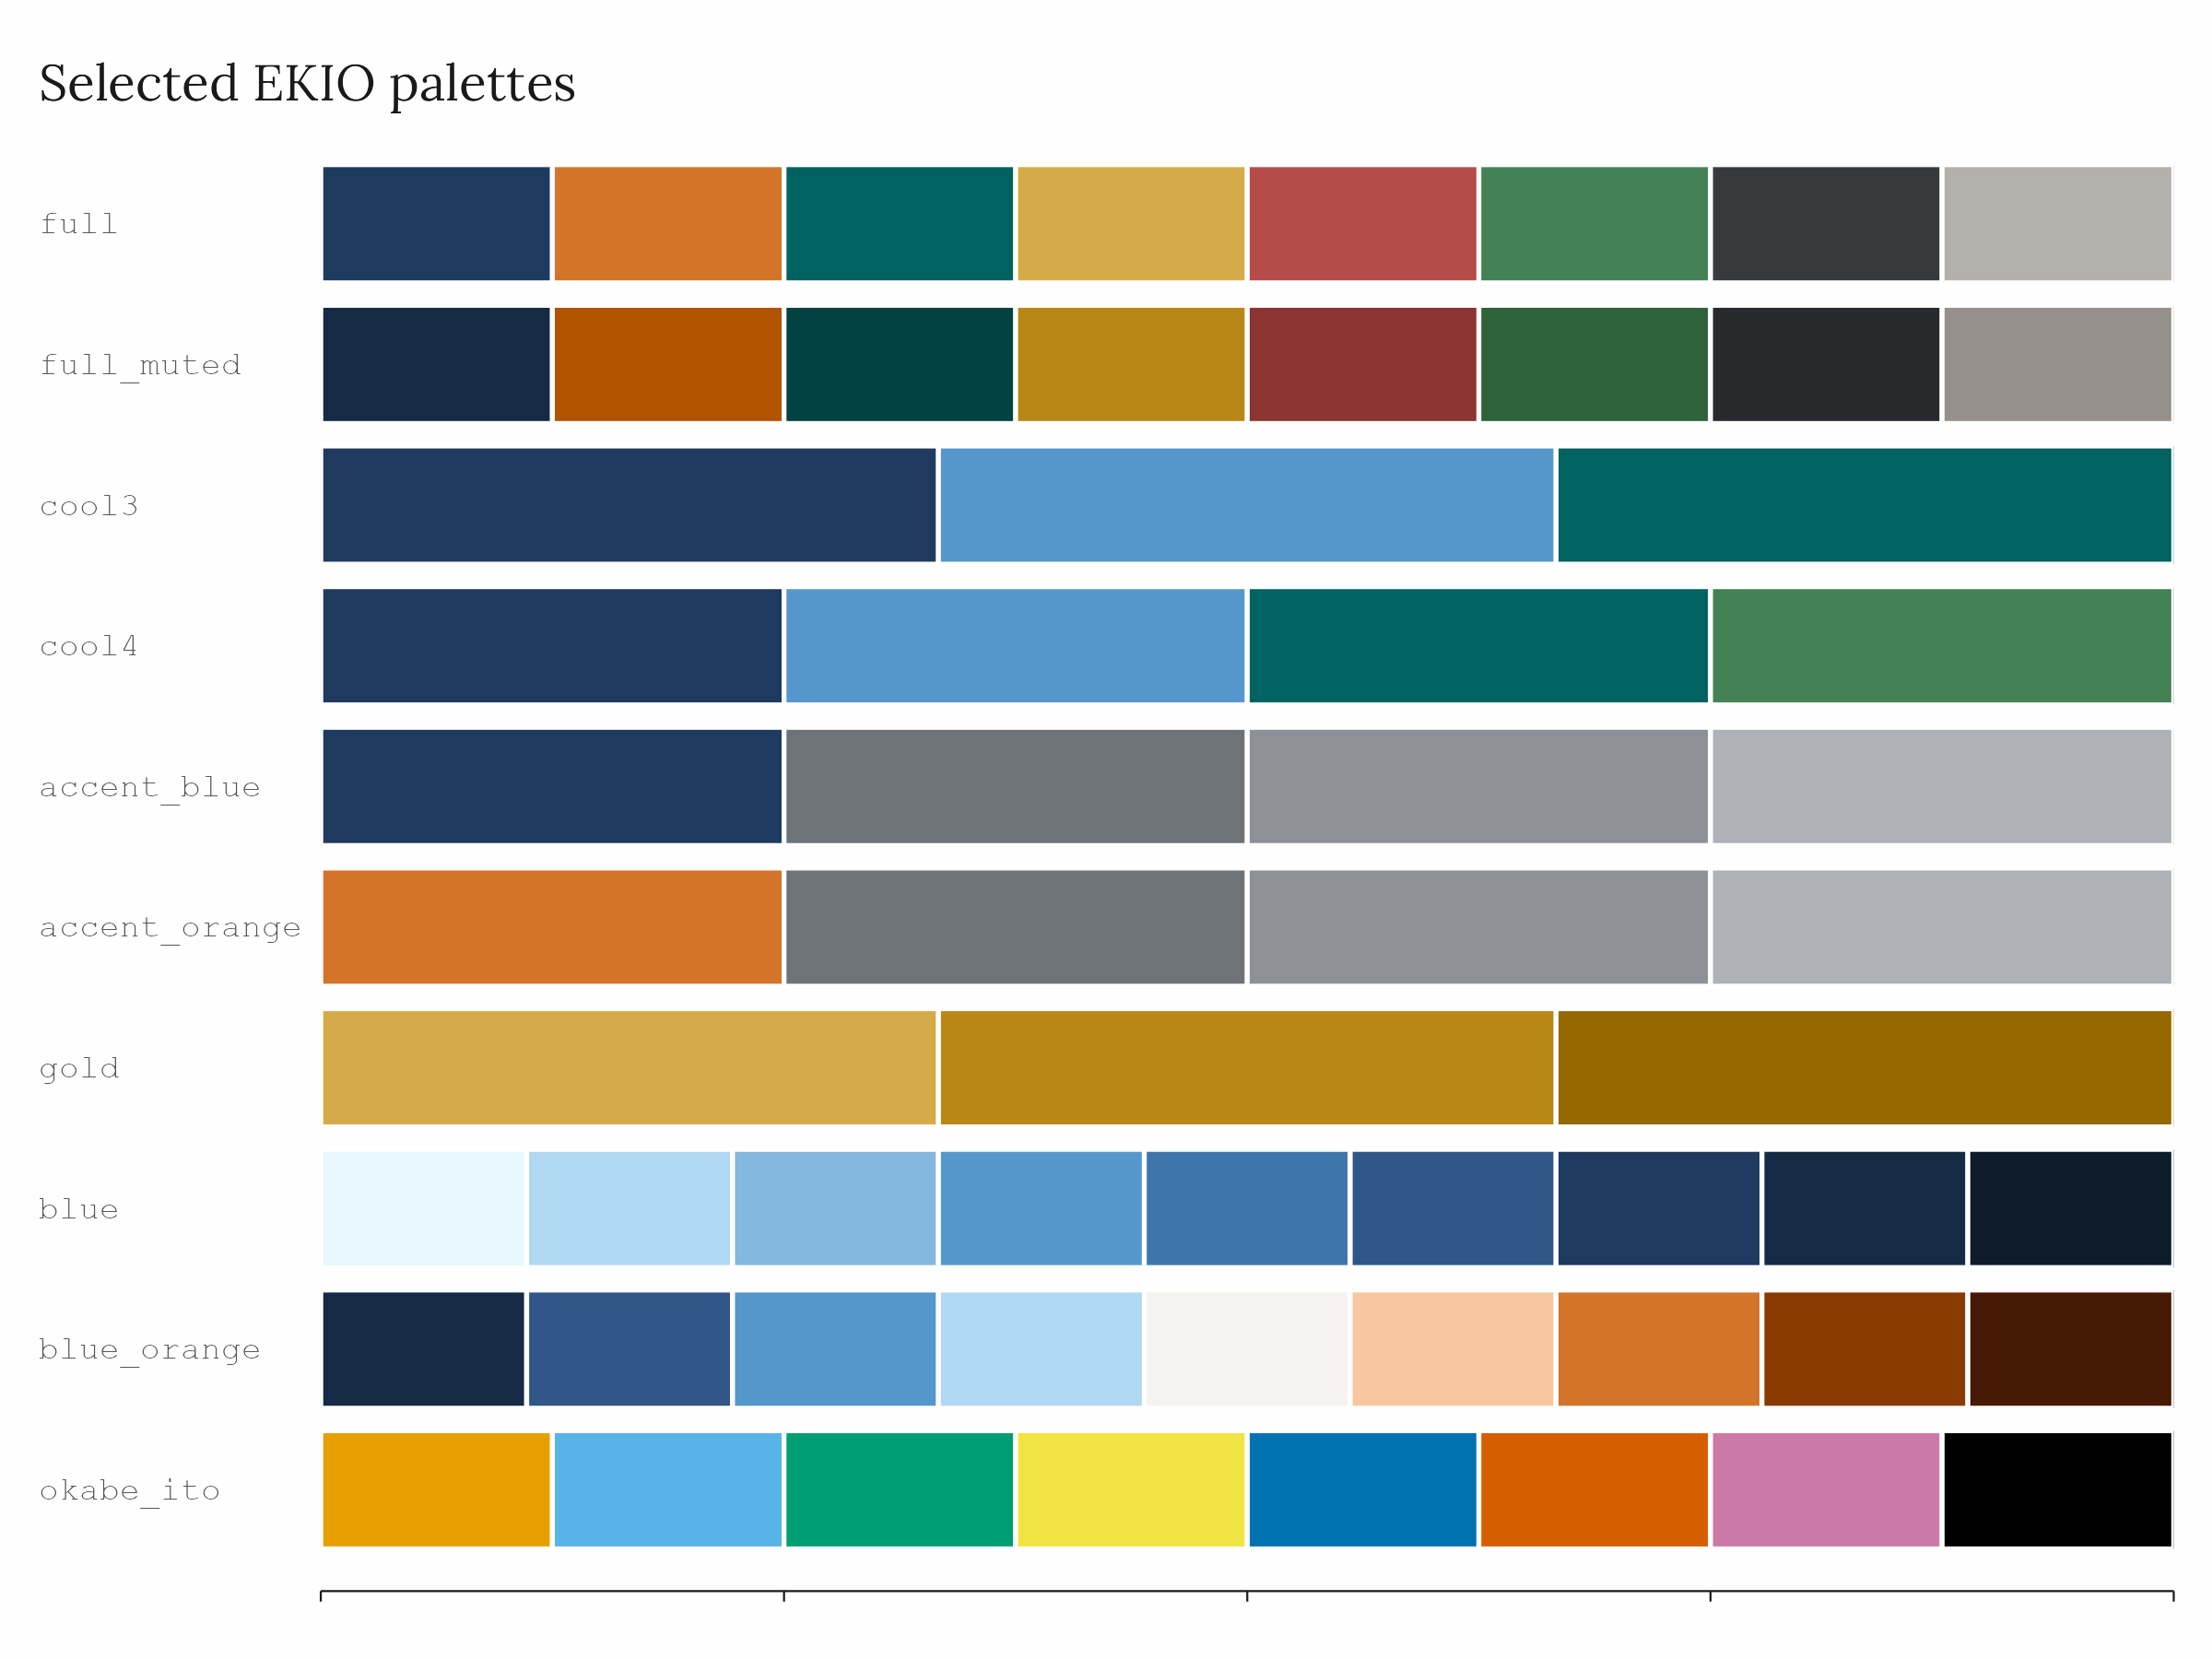
Discrete and continuous scales are provided for both
color and fill.
# Discrete (categorical palettes)
scale_color_ekio_d("full")
scale_fill_ekio_d("full")

# Continuous (sequential / diverging palettes)
scale_color_ekio_c("blue")
scale_fill_ekio_c("blue_orange")High-level builders create complete, publication-ready plots with smart defaults.
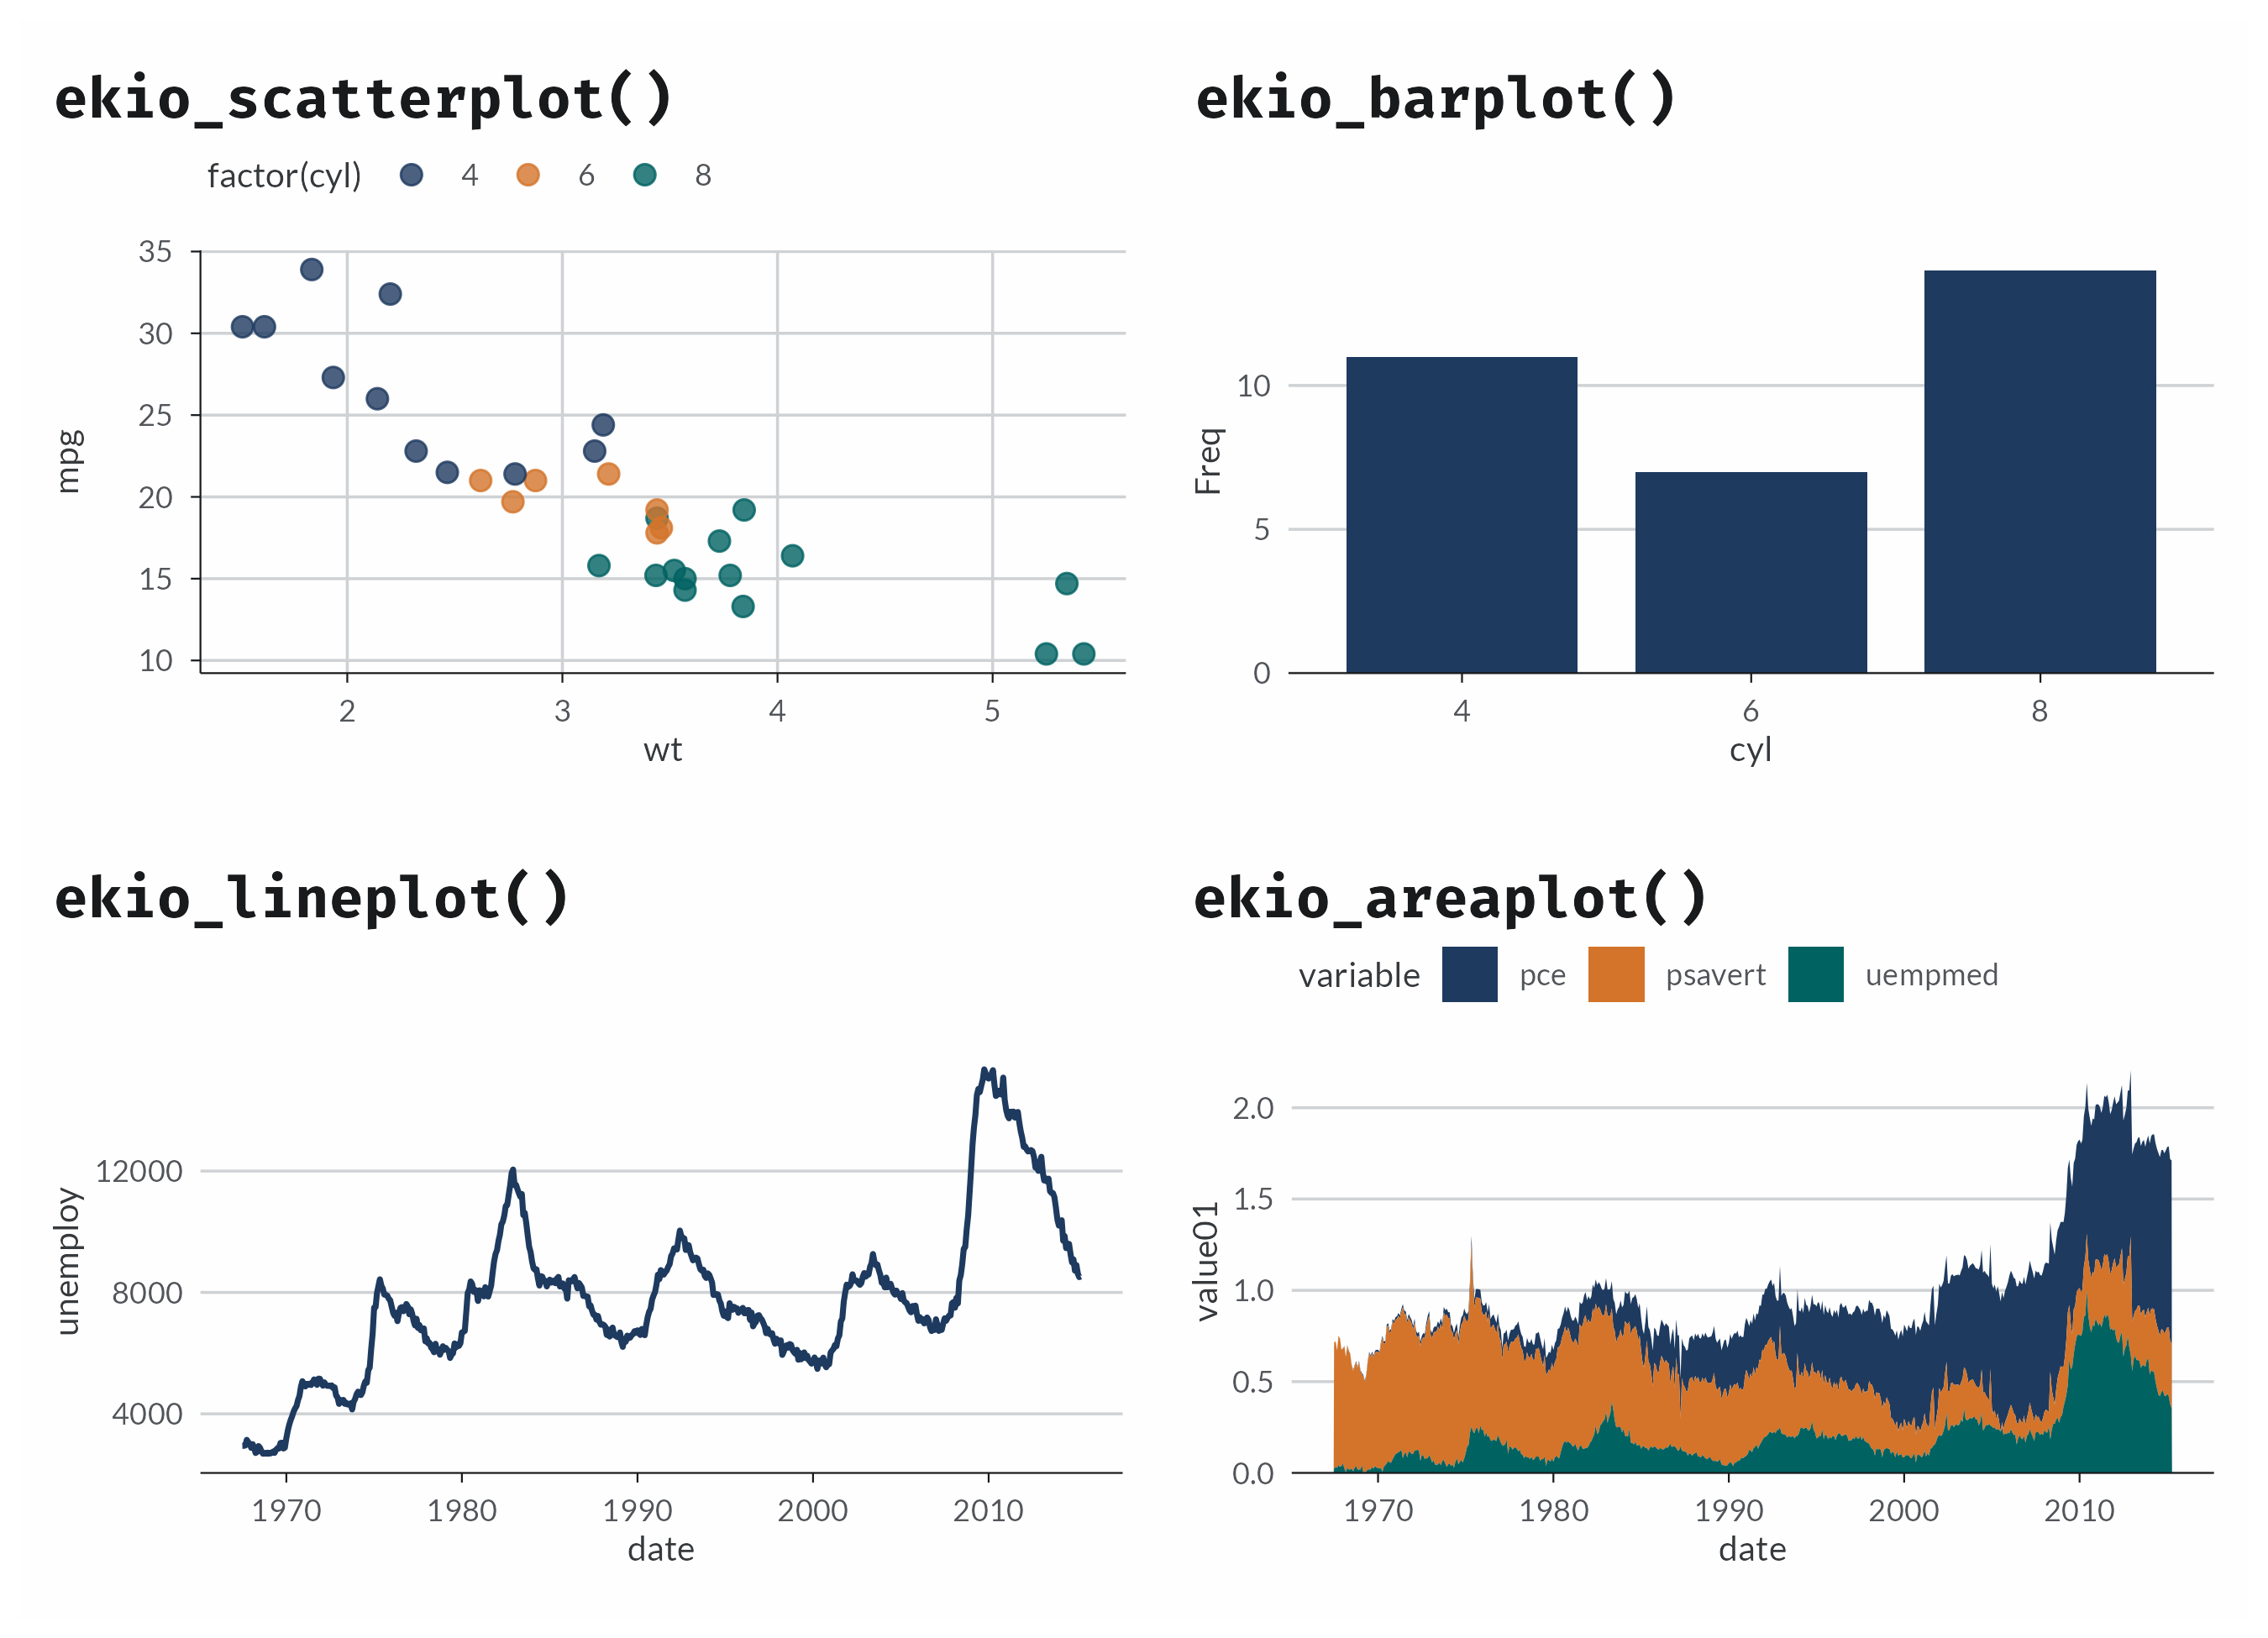
See vignette("getting-started", package = "ekioplot"),
the palette
gallery, and the package website at https://viniciusoike.github.io/ekioplot/.
These binaries (installable software) and packages are in development.
They may not be fully stable and should be used with caution. We make no claims about them.
Health stats visible at Monitor.