The hardware and bandwidth for this mirror is donated by dogado GmbH, the Webhosting and Full Service-Cloud Provider. Check out our Wordpress Tutorial.
If you wish to report a bug, or if you are interested in having us mirror your free-software or open-source project, please feel free to contact us at mirror[@]dogado.de.
![]()
![]()
The easysurv R package provides tools to simplify
survival data analysis and model fitting.
This includes tools to inspect survival data, plot Kaplan-Meier curves, assess the proportional hazards assumption, fit parametric survival models, predict and plot survival and hazards, and export the outputs to Excel.
For fitting survival models, the package provides a simple interface
to flexsurv::flexsurvreg(),
flexsurv::flexsurvspline(),
flexsurvcure::flexsurvcure(), and
survival::survreg().
By default, the package uses the flexsurv engine
(flexsurv::flexsurvreg()) and provides a helpful starting
point to explore survival extrapolations across frequently used
distributions (such as exponential, generalized gamma, gamma, Gompertz,
log-logistic, log-normal and Weibull).
If you haven’t already, install R and consider using RStudio as your integrated development environment (IDE).
# You will need to have the pak package installed.
install.packages("pak")

# Then, install easysurv either from GitHub for the latest version:
pak::pkg_install("Maple-Health-Group/easysurv")

# Or from CRAN for the latest stable version:
pak::pkg_install("easysurv")# Attach the easysurv library
library(easysurv)
# Open an example script
quick_start()
## Note: The default file name is "easysurv_start.R", but you can define your own, e.g.
## quick_start("my_file_name.R")
# Access help files
help(package = "easysurv")# Load the easy_lung data from the easysurv package
# Recode the "status" variable to create an event indicator (0/1)
surv_data <- easy_lung |>
dplyr::mutate(
time = time,
event = status - 1,
group = sex,
.after = time
) |>
dplyr::select(-c(inst, ph.karno, pat.karno)) # remove some unused columns
# Make the group variable a factor and assign level labels.
surv_data <- surv_data |>
dplyr::mutate_at("group", as.factor)
levels(surv_data$group) <- c("Male", "Female")inspect_surv_data()inspect_surv_data(
data = surv_data,
time = "time",
event = "event",
group = "group"
)
get_km()km_check <- get_km(
data = surv_data,
time = "time",
event = "event",
group = "group"
)
print(km_check)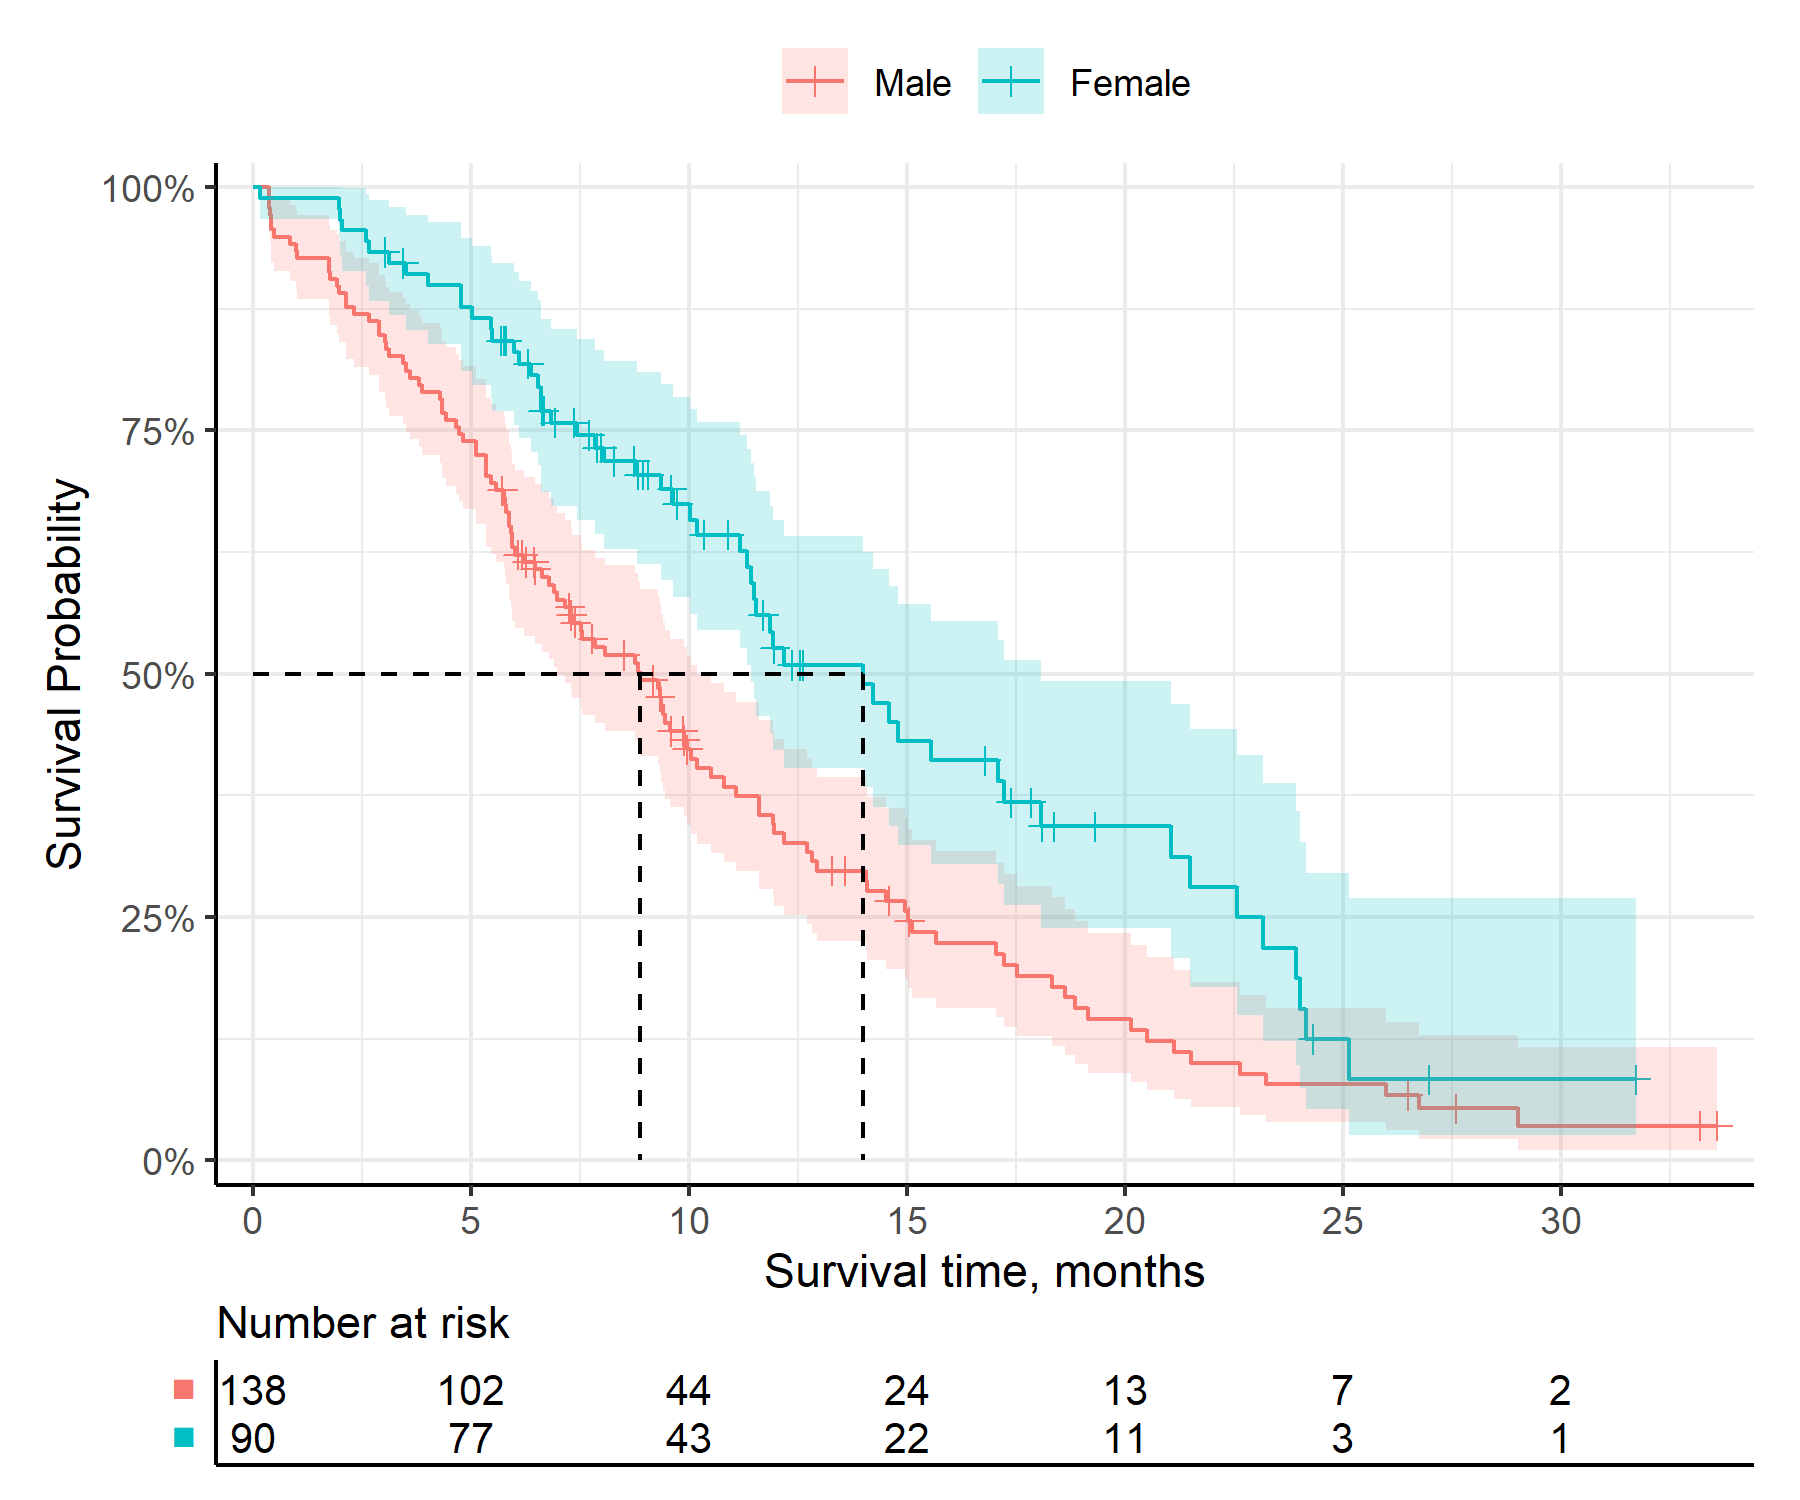

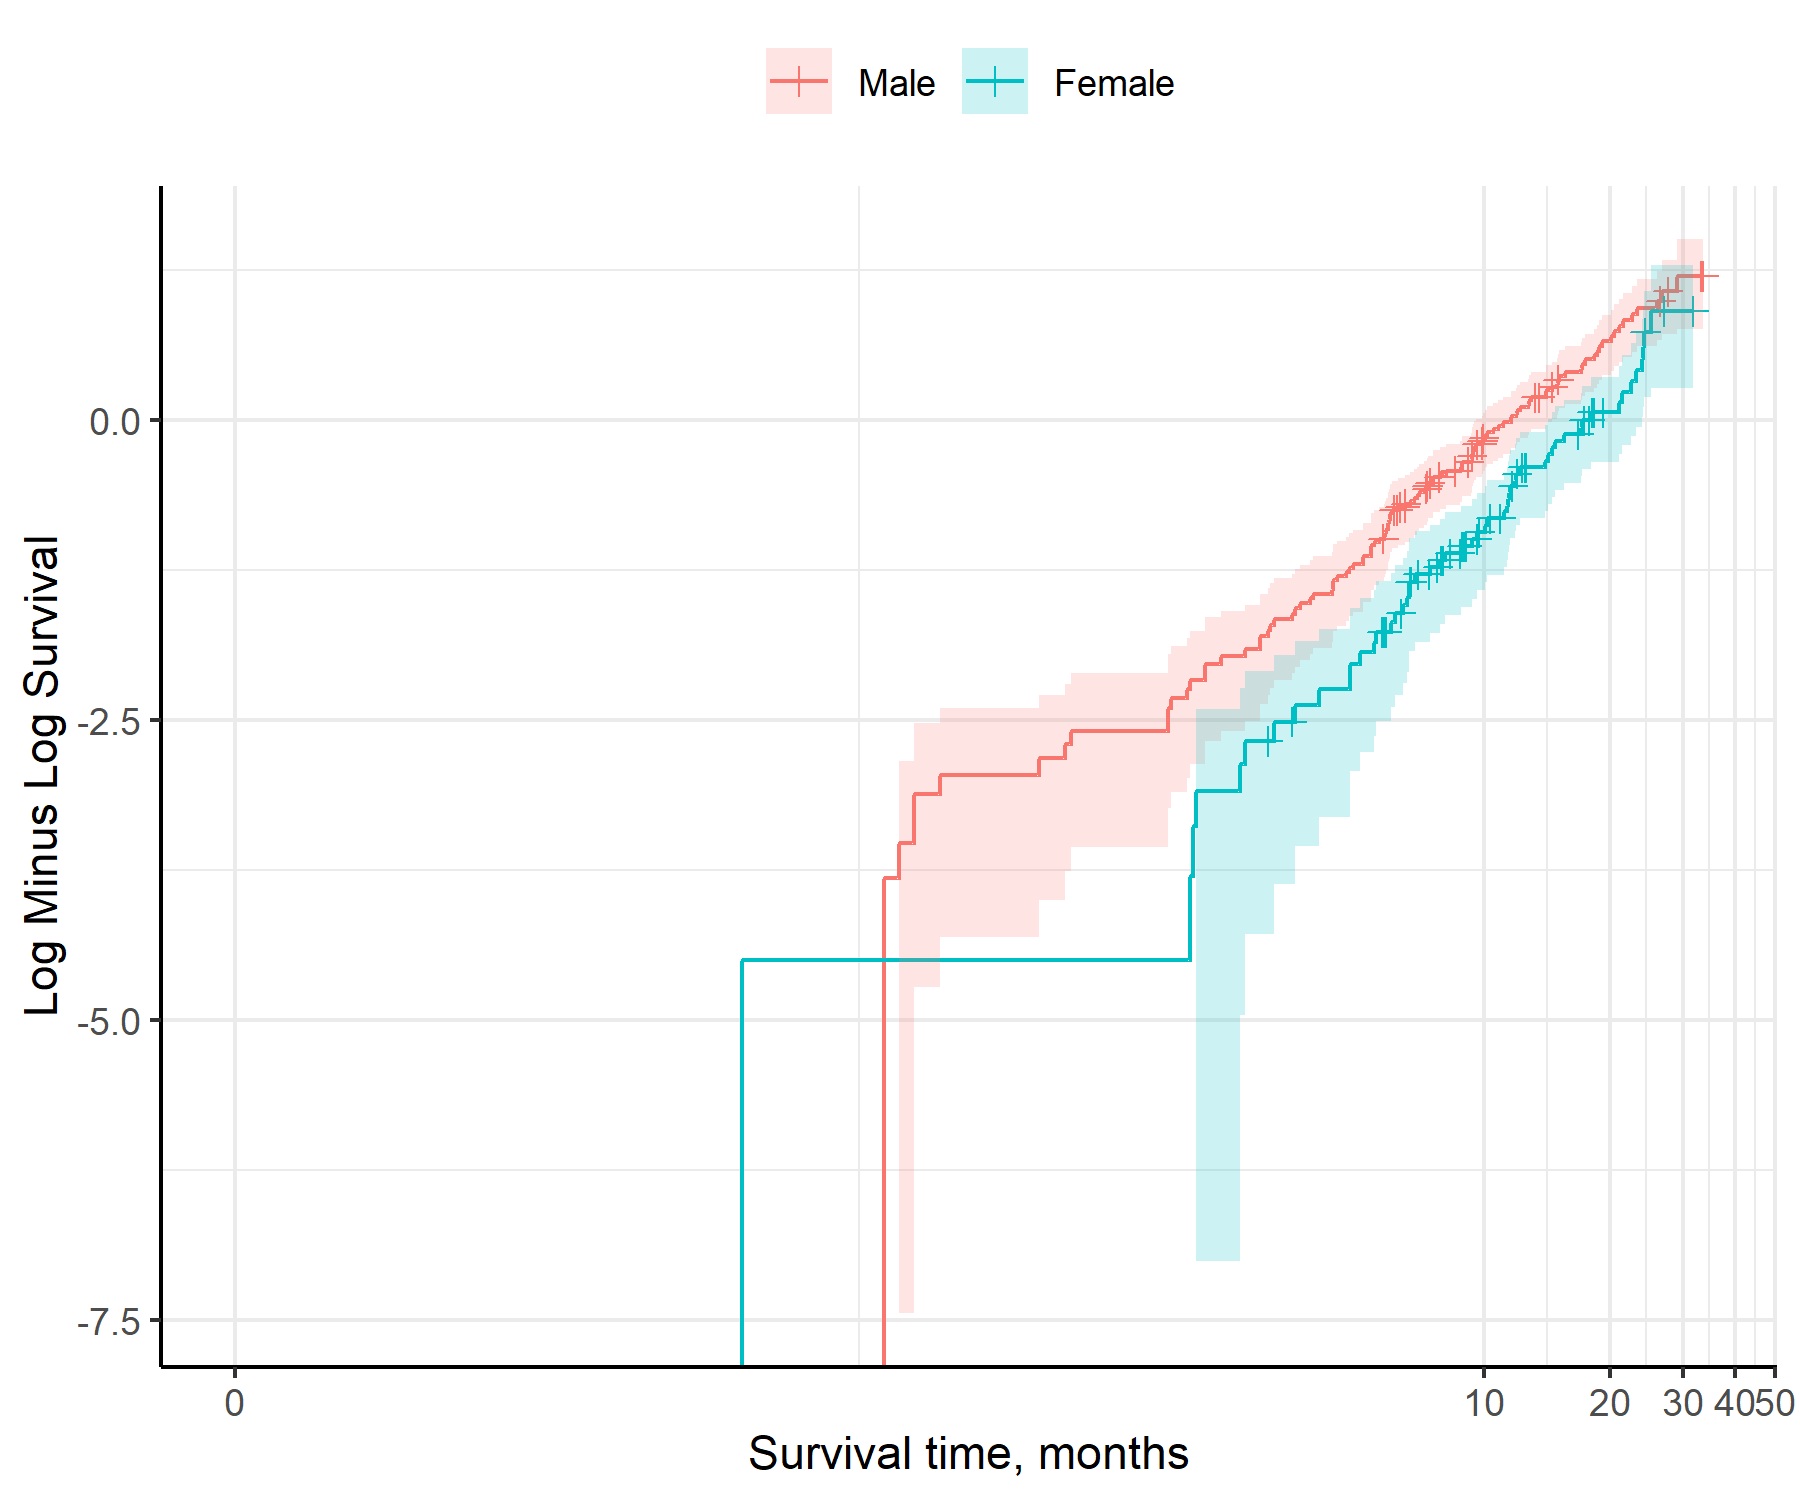
test_ph()ph_check <- test_ph(
data = surv_data,
time = "time",
event = "event",
group = "group"
)
print(ph_check)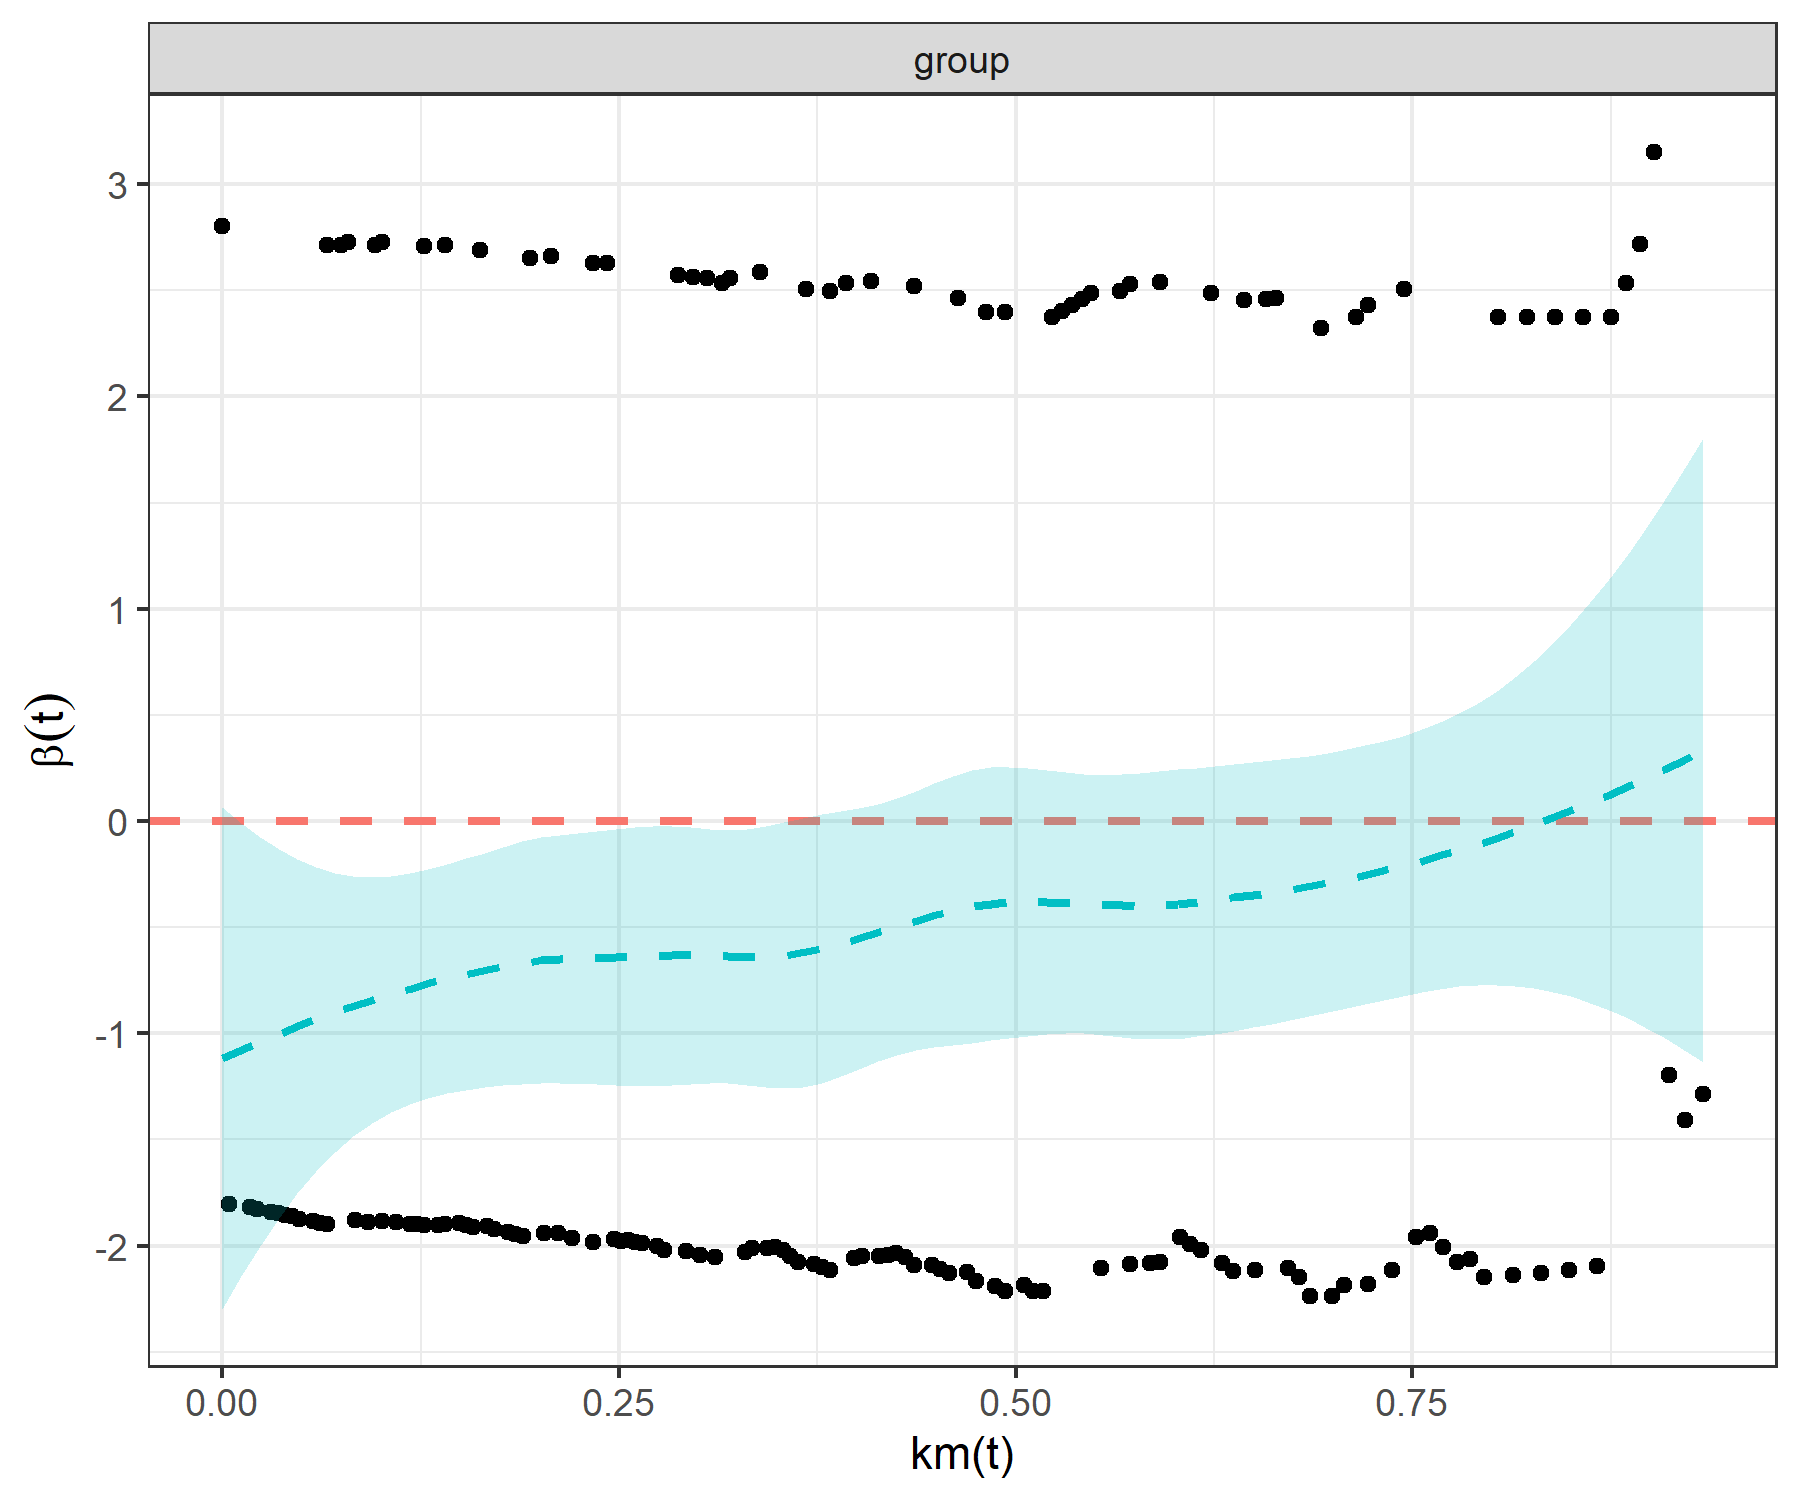

fit_models()separate_models <- fit_models(
data = surv_data,
time = "time",
event = "event",
predict_by = "group"
)
print(separate_models)
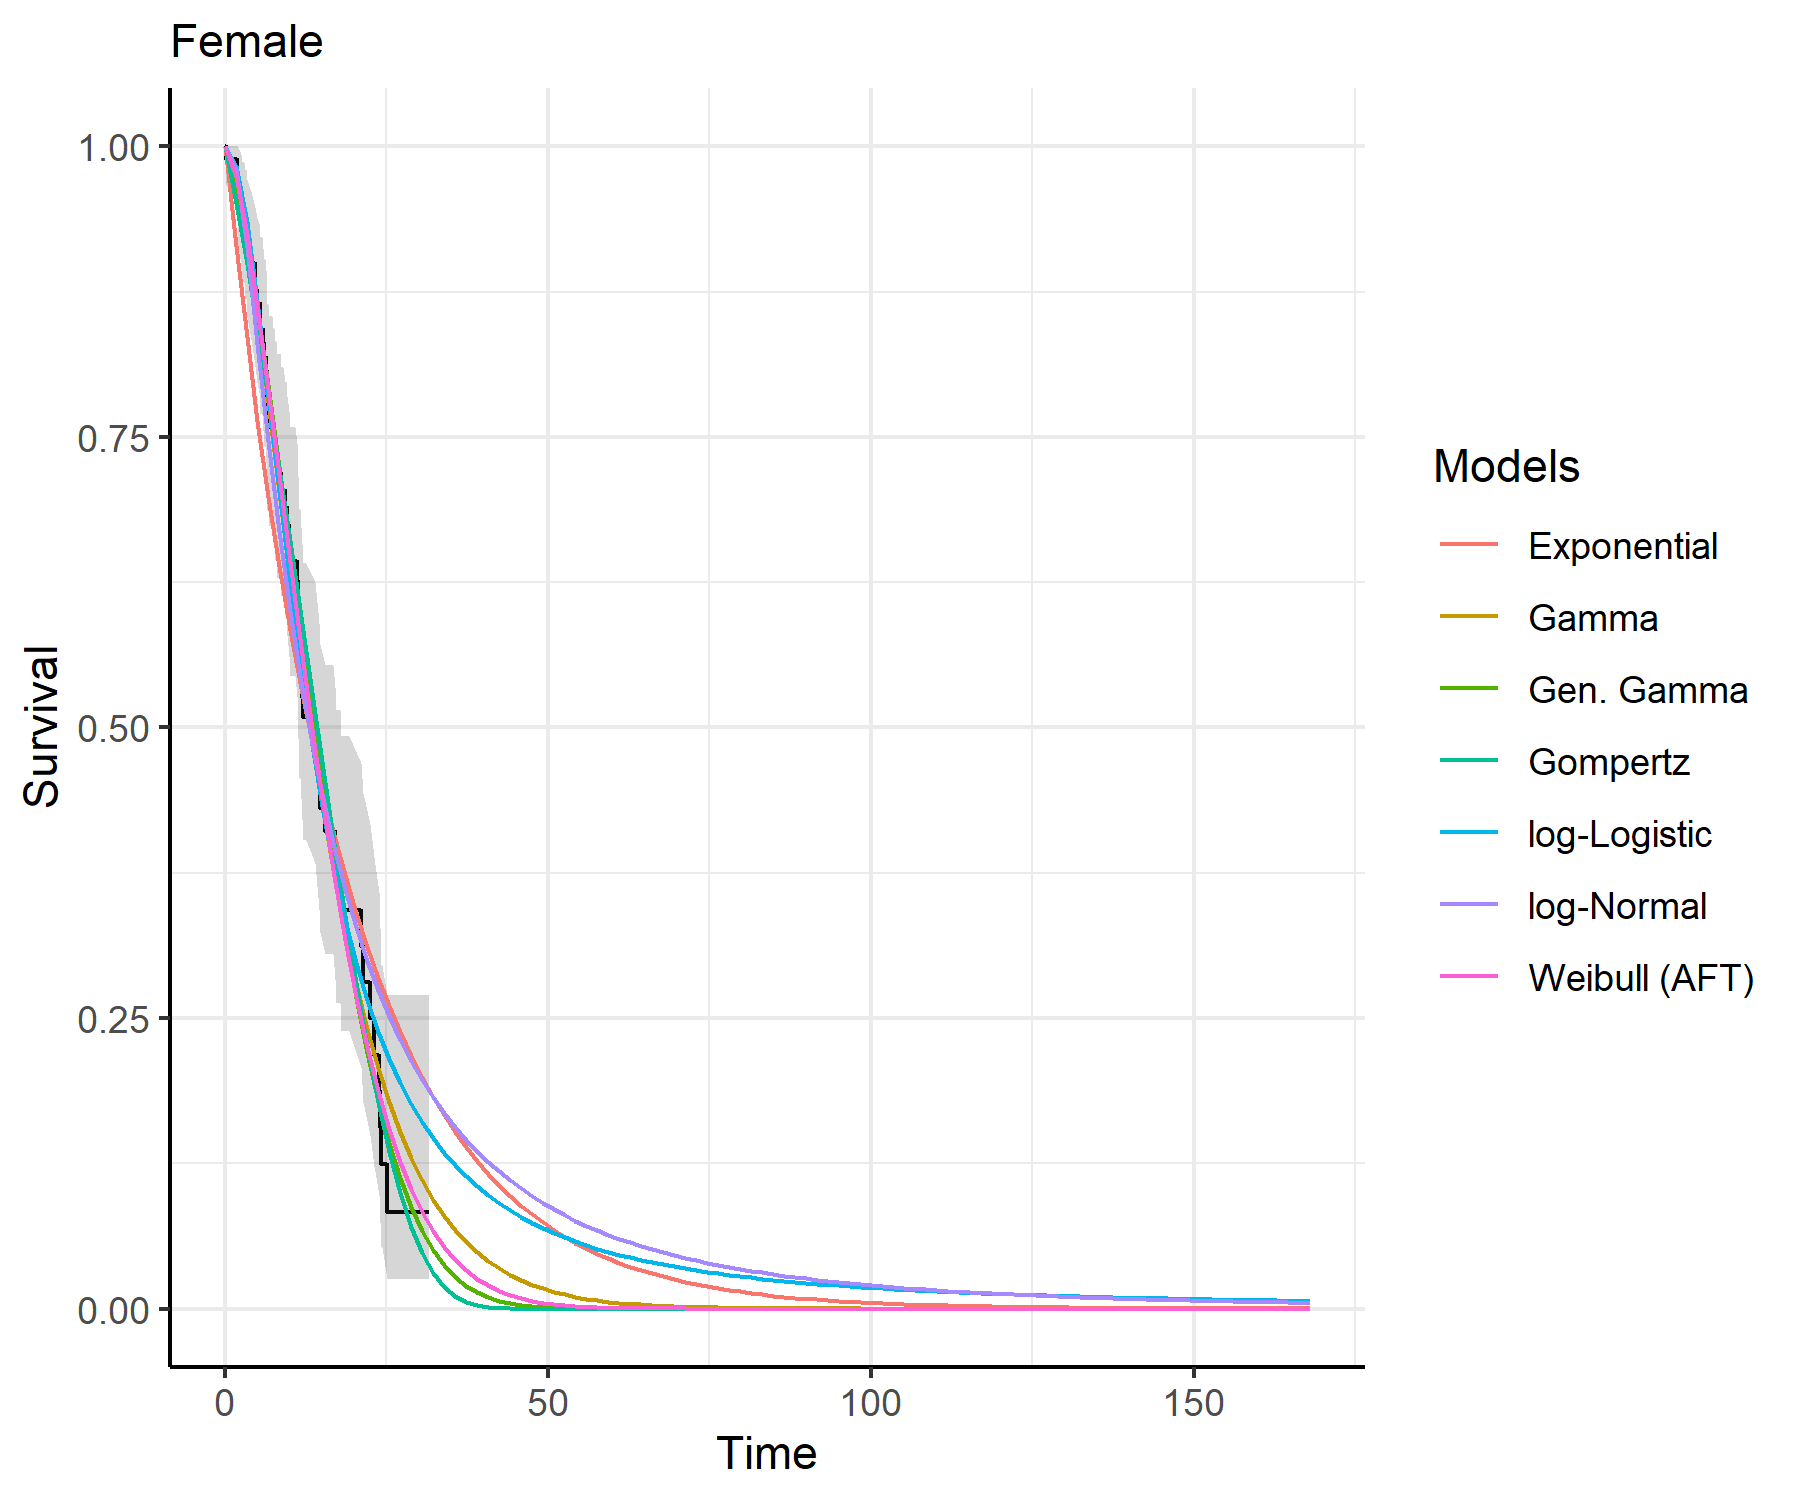
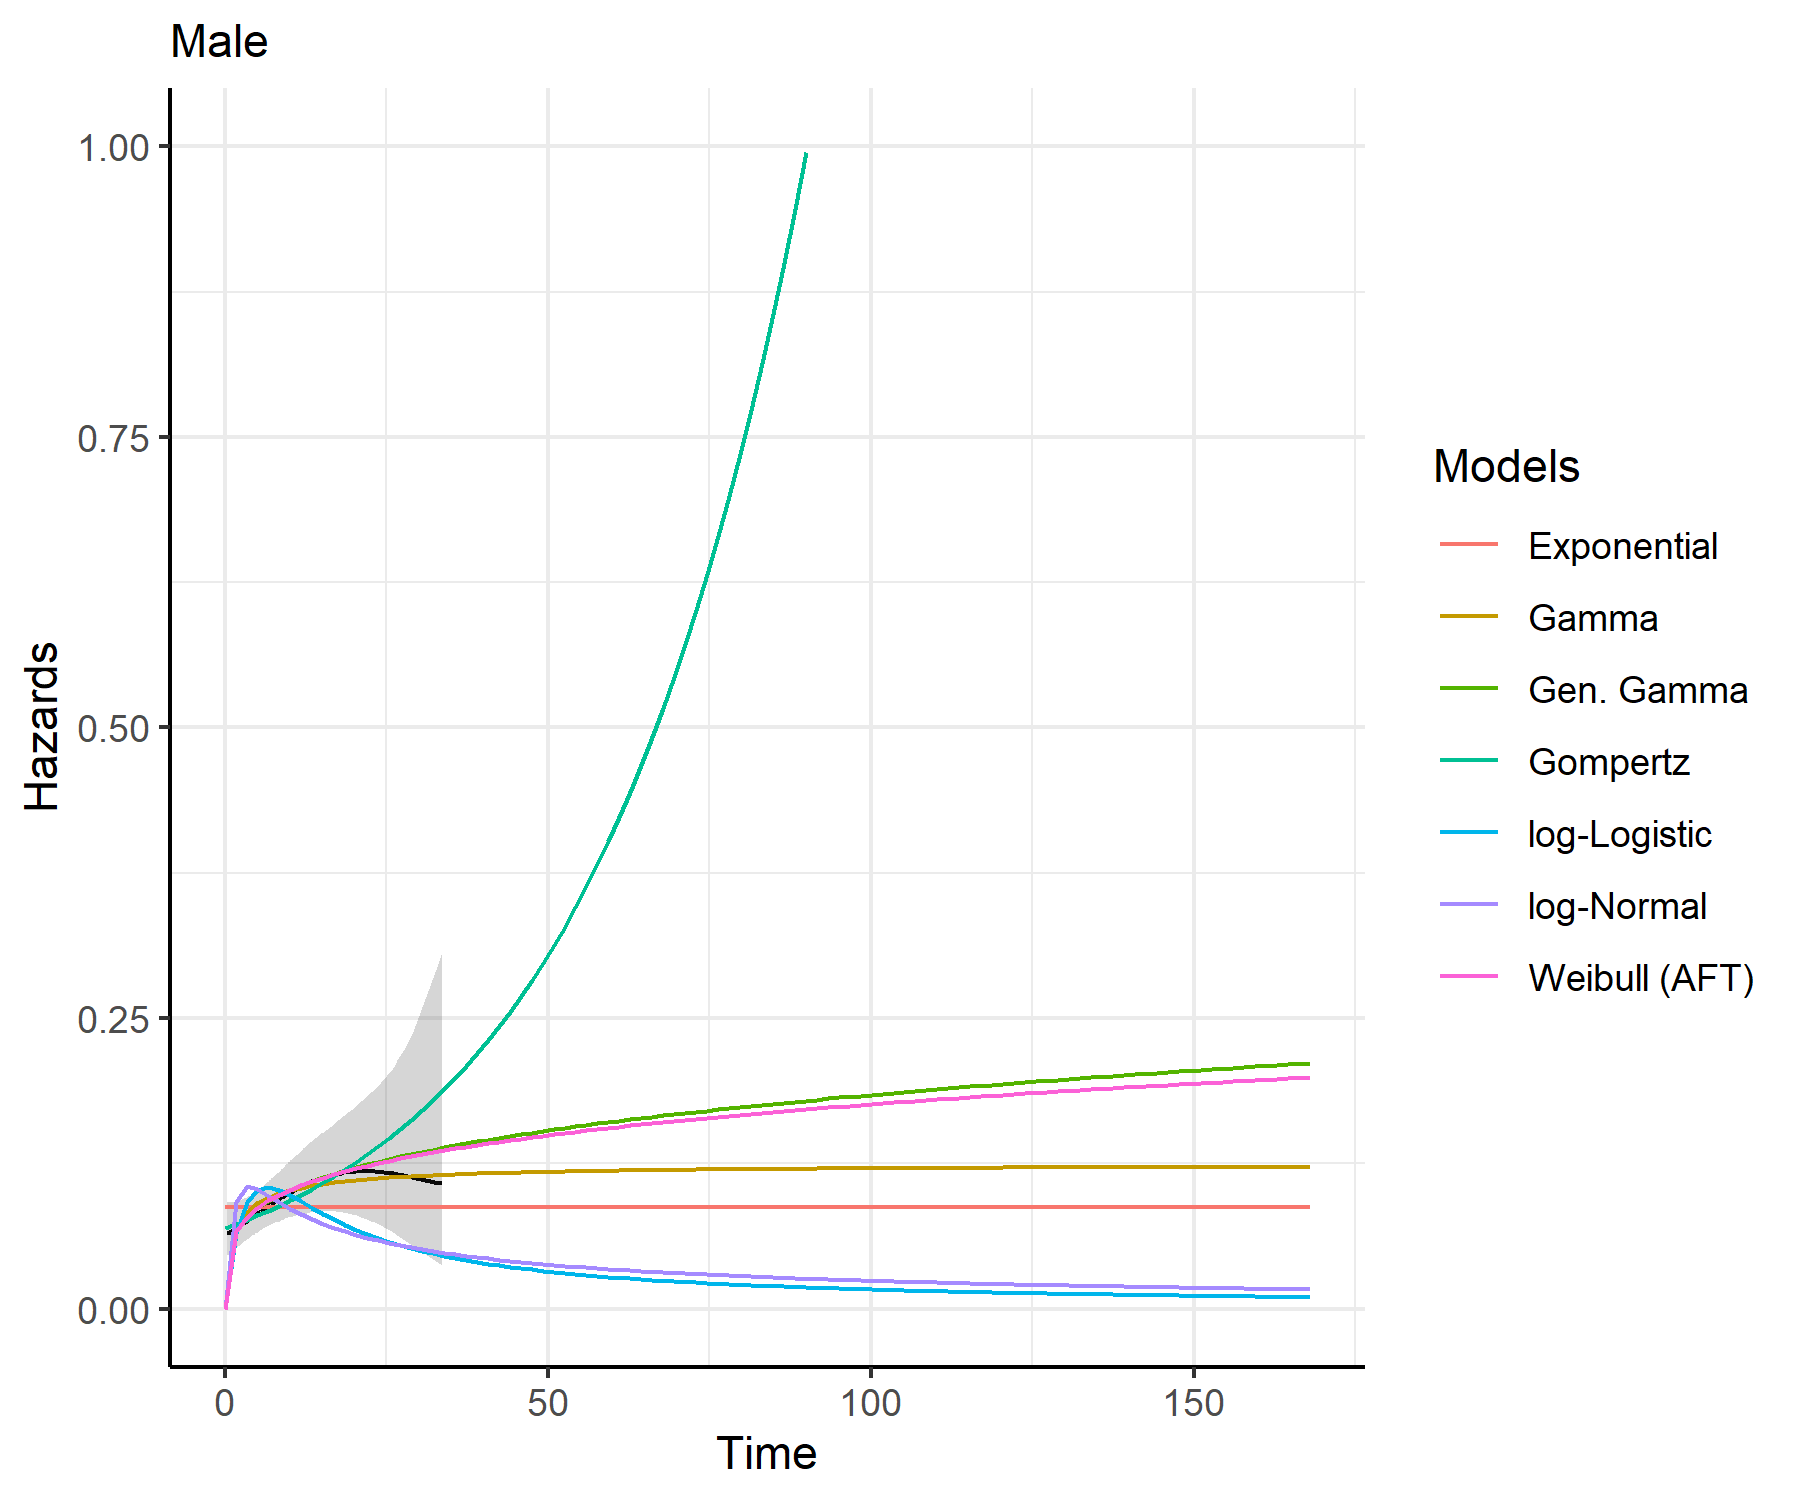
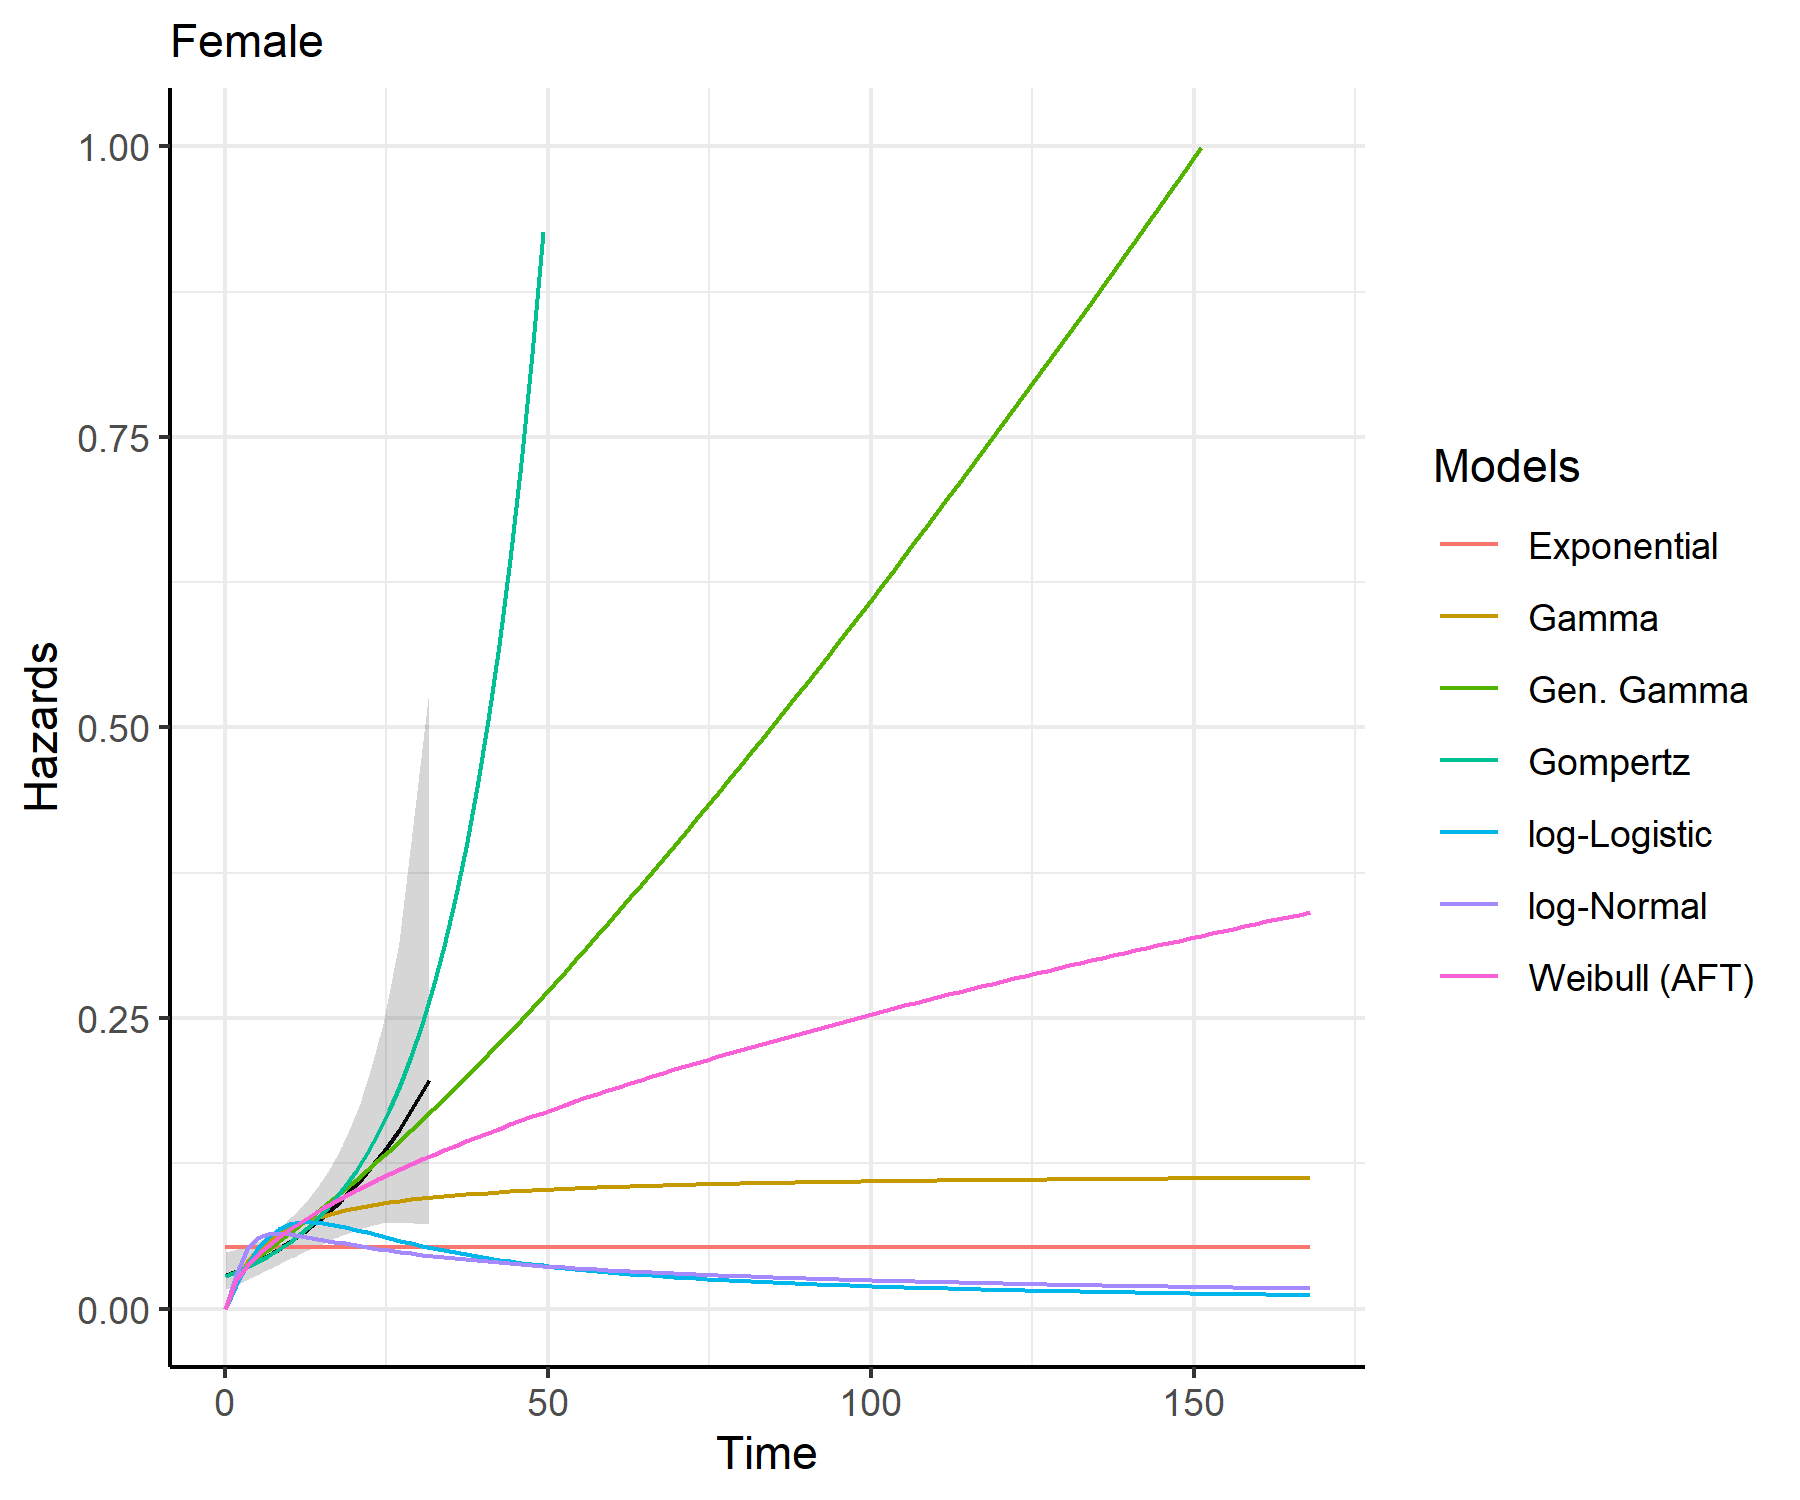
predict_and_plot()plots <- predict_and_plot(fit_models = separate_models)
print(plots)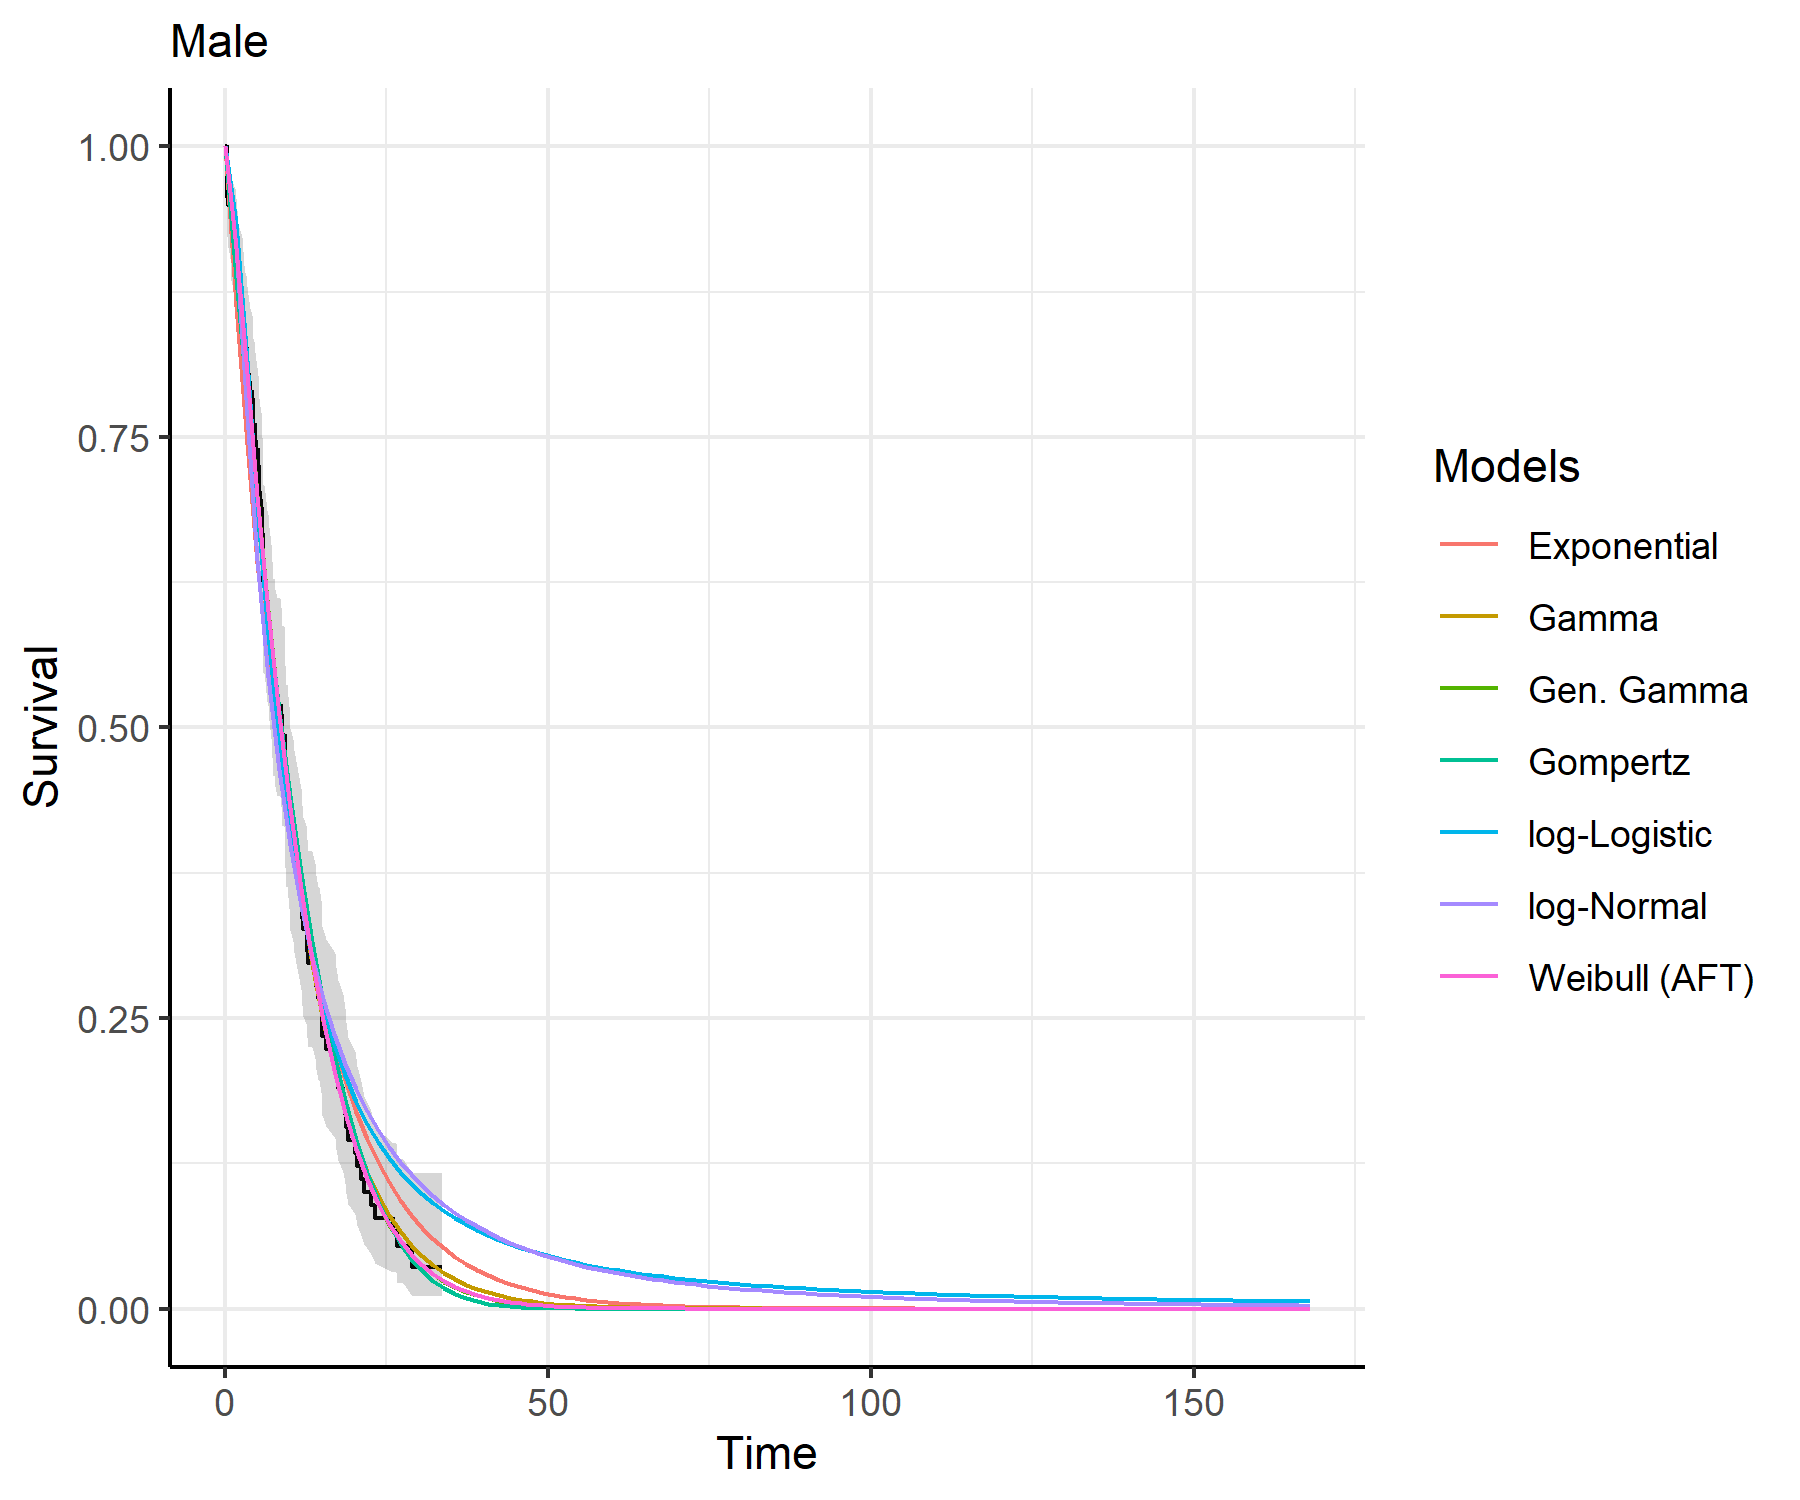

These binaries (installable software) and packages are in development.
They may not be fully stable and should be used with caution. We make no claims about them.
Health stats visible at Monitor.