The hardware and bandwidth for this mirror is donated by dogado GmbH, the Webhosting and Full Service-Cloud Provider. Check out our Wordpress Tutorial.
If you wish to report a bug, or if you are interested in having us mirror your free-software or open-source project, please feel free to contact us at mirror[@]dogado.de.
droughtevents provides tools to detect, summarize, and
visualize drought events from drought-related index time series (e.g.,
SPEI, SPI). Given a time series and a threshold, the package identifies
periods of sustained below-threshold values, computes summary statistics
for each event (duration, intensity, severity, timing), and offers
ggplot2-based plotting functions to visualize the time
series and highlight the detected events.
You can install the development version of droughtevents
from GitHub with:
# install.packages("remotes")
remotes::install_github("ajpelu/droughtevents")library(droughtevents)
library(ggplot2)droughts() identifies drought events in a time series
when a given index falls below a specified threshold for at least
min_duration consecutive months (2 by default).
data(spei_granada)

result <- droughts(spei_granada, vname = "spei12", threshold = -1.28)

result$drought_assessment
#> # A tibble: 17 × 9
#>    index_events d_duration d_intensity d_severity lowest_spei month_peak minyear
#>           <int>      <dbl>       <dbl>      <dbl>       <dbl>      <dbl>   <dbl>
#>  1            3         11       -1.93       21.2        -2.3         10    1945
#>  2            5          4       -1.45        5.8        -1.6          5    1949
#>  3            7          2       -1.45        2.9        -1.5         12    1950
#>  4           11          2       -1.35        2.7        -1.4          6    1965
#>  5           21         14       -1.83       25.6        -2.2         10    1994
#>  6           23          9       -1.63       14.7        -1.9          6    1998
#>  7           27          7       -1.64       11.5        -1.7          7    2005
#>  8           29          9       -1.92       17.3        -2.2          8    2012
#>  9           31          5       -1.38        6.9        -1.5          5    2014
#> 10           33          5       -1.64        8.2        -1.9          3    2015
#> 11           35          3       -1.5         4.5        -1.7         10    2016
#> 12           37         11       -1.6        17.6        -2.1         12    2017
#> 13           39         11       -1.7        18.7        -2           10    2019
#> 14           41          2       -1.5         3          -1.7         12    2020
#> 15           43         21       -1.58       33.2        -2.1          1    2021
#> 16           45         12       -1.91       22.9        -2.4          1    2023
#> 17           47          5       -1.54        7.7        -1.7          9    2024
#> # ℹ 2 more variables: maxyear <dbl>, rangeDate <chr>
The returned object is a named list with three elements:
data: the original data, with drought flags and
durations added.drought_events: only the rows that belong to a detected
drought event.drought_assessment: one row per event, with its
duration, intensity, severity, and timing.plot_drought_ts() draws the index as a bar plot,
coloring positive (wet, blue) and negative (dry, red)
periods differently.
plot_drought_ts(spei_granada, vname = "spei12", title = "SPEI-12 Time Series")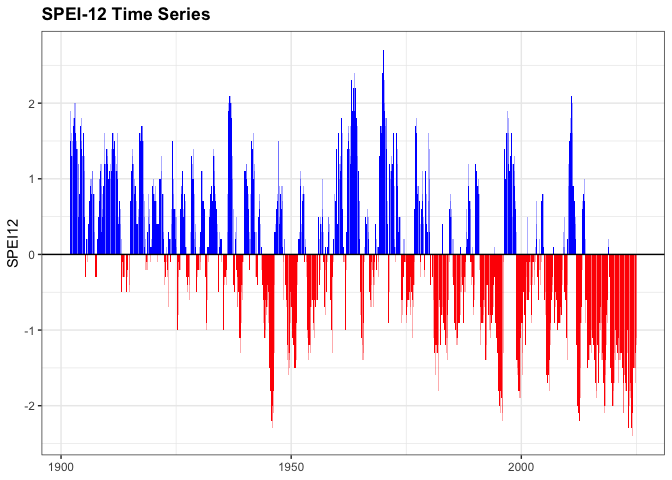
You can also aggregate by year:
plot_drought_ts(spei_granada, vname = "spei12", by_year = TRUE)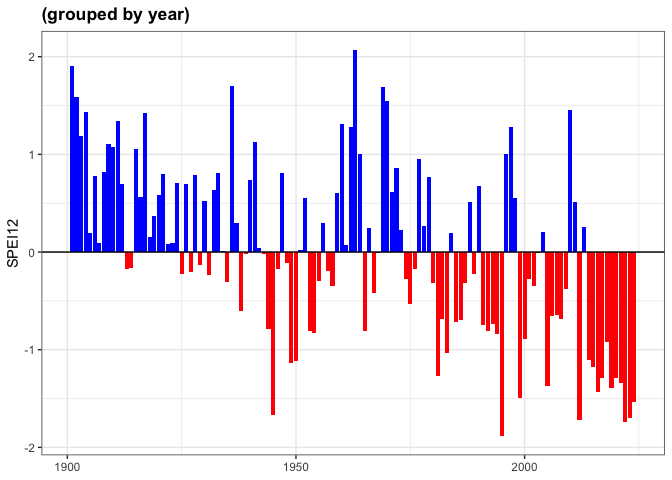
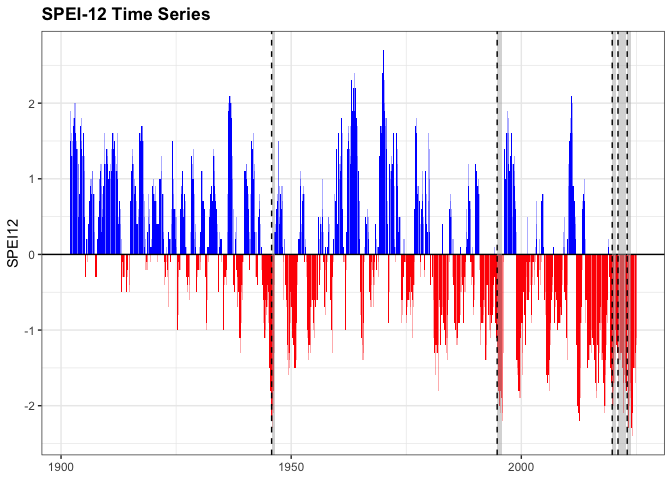
add_drought_events() overlays the detected events on top
of a plot created with plot_drought_ts(), as shaded bands
or vertical lines, or both.
p <- plot_drought_ts(spei_granada, vname = "spei12", title = "SPEI-12 Time Series")

p |>
  add_drought_events(
    drought_assessment = result$drought_assessment,
    which_events = "top",
    metric = "severity",
    top_n = 5,
    type = "both",
    show_severity = FALSE
  )
The package ships with spei_granada, a monthly SPEI time
series (6, 12, 24, and 48-month scales) for Granada, Spain, covering
1901-2024. See ?spei_granada for details and the data
source.
Vicente-Serrano, S.M., Beguería, S., López-Moreno, J.I. (2010). A Multiscalar Drought Index Sensitive to Global Warming: The Standardized Precipitation Evapotranspiration Index. Journal of Climate, 23(7), 1696-1718. 10.1175/2009JCLI2909.1
These binaries (installable software) and packages are in development.
They may not be fully stable and should be used with caution. We make no claims about them.
Health stats visible at Monitor.