The hardware and bandwidth for this mirror is donated by dogado GmbH, the Webhosting and Full Service-Cloud Provider. Check out our Wordpress Tutorial.
If you wish to report a bug, or if you are interested in having us mirror your free-software or open-source project, please feel free to contact us at mirror[@]dogado.de.
![]()
![]()
![]()
The package {ggdensity}1
allows for plotting interpretable bivariate densities by using highest
density ranges (HDRs). For example:
library(tibble)
library(ggplot2)
library(ggdensity)

set.seed(10)
df <- tibble(
  x = c(rnorm(100), rnorm(100, mean = 3)),
  y = c(rnorm(100), rnorm(100, mean = 3))
)

ggplot(df, aes(x,y))+
  stat_hdr()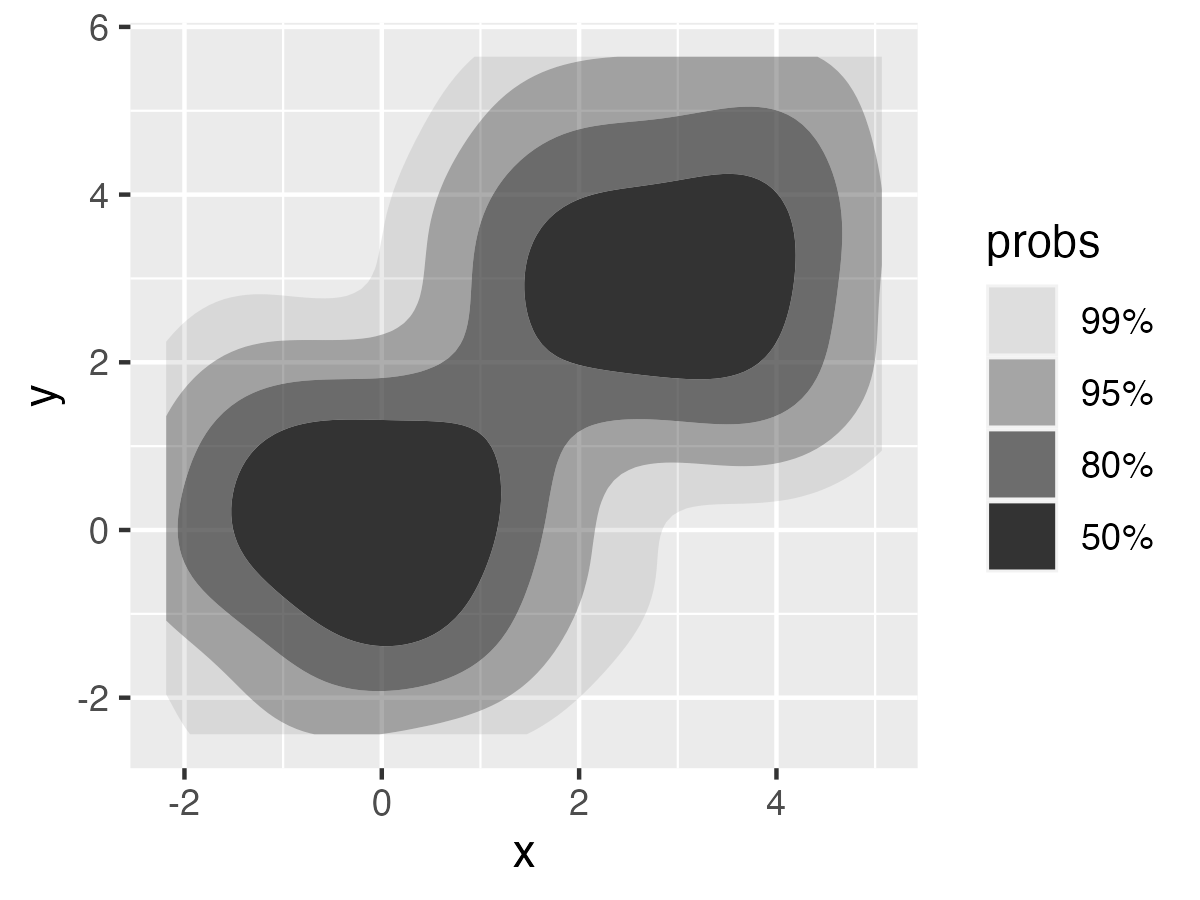
{densityarea} gives direct access to these HDRs, either
as data frames or as simple
features, for further analysis.
You can install {densityarea} from CRAN with:
install.packages("densityarea")Or you can install the development version from GitHub with:
# install.packages("devtools")
devtools::install_github("JoFrhwld/densityarea")The use case the package was initially developed for was for estimating vowel space areas.
library(densityarea)
library(dplyr)
library(tidyr)
library(sf)

data(s01)

# initial data processing

s01 |>
  mutate(lF1 = -log(F1),
         lF2 = -log(F2))->
  s01
To get this speaker’s vowel space area we can pass the data through
dplyr::reframe()
s01 |>
  reframe(
    density_area(lF2, lF1, probs = 0.8)
  )
#> # A tibble: 1 × 3
#>   level_id  prob  area
#>      <int> <dbl> <dbl>
#> 1        1   0.8 0.406
Or, we could get the spatial polygon associated with the 80% probability level
s01 |>
  reframe(
    density_polygons(lF2, lF1, probs = 0.8, as_sf = T)
  )
#> # A tibble: 1 × 3
#>   level_id  prob                                                        geometry
#>      <int> <dbl>                                                       <POLYGON>
#> 1        1   0.8 ((-7.777586 -6.009484, -7.801131 -6.010429, -7.824676 -6.01700…
For more details on using {densityarea}, see , and for
further information on using spatial polygons, see
vignette("sf-operations").
Otto J, Kahle D (2023). ggdensity: Interpretable Bivariate Density Visualization with ‘ggplot2’. https://jamesotto852.github.io/ggdensity/ https://github.com/jamesotto852/ggdensity/↩︎
These binaries (installable software) and packages are in development.
They may not be fully stable and should be used with caution. We make no claims about them.
Health stats visible at Monitor.