The hardware and bandwidth for this mirror is donated by dogado GmbH, the Webhosting and Full Service-Cloud Provider. Check out our Wordpress Tutorial.
If you wish to report a bug, or if you are interested in having us mirror your free-software or open-source project, please feel free to contact us at mirror[@]dogado.de.
![]()
Cumulative residual (CURE) plots assess the goodness-of-fit of a
covariate in a generalized linear regression model, usually a negative
binomial regression or a Poisson regression. The package
cureplots produces CURE plots for the requested variables
produced with ggplot2 or a
table to easily produce a customized plot with the desired package.
Install the latest CRAN version with
install.packages("cureplots")You can install the development version of cureplots
from GitHub with the following:
# install.packages("devtools")
devtools::install_github("gbasulto/cureplots")| Name | Purpose |
|---|---|
calculate_cure_dataframe |
Calculate CURE dataframe. Useful to produce customized CURE plots or CURE plots with variables not included in the model or transformations of variables that were included in the model (e.g., CURE plot for AADT when log(AADT) was included in the model). |
cure_plot |
Produce default CURE plot by either providing model and variable to
plot or an output from calculate_cure_dataframe
function. |
resample_residuals |
Resample cumulative residuals to overlay to CURE plots and better interpret results. |
washington_roads |
Curated dataframe of crashes in Washington roads. |
Functions in cureplots
The example below shows
A Poisson GLM model is adjusted to simulated data using the package
glm. The functions also work with the gam
package.
library(cureplots)

## basic example

set.seed(2000)

## Define parameters
beta <- c(-1, 0.3, 3)

## Simulate idependent variables
n <- 900
AADT <- c(runif(n, min = 2000, max = 150000))
nlanes <- sample(x = c(2, 3, 4), size = n, replace = TRUE)
LNAADT <- log(AADT)

## Simulate dependent variable
theta <- exp(beta[1] + beta[2] * LNAADT + beta[3] * nlanes)
y <- rpois(n, theta)

## Fit model
mod <- glm(y ~ LNAADT + nlanes, family = poisson)

## Calculate residuals
res <- residuals(mod, type = "response")

## Calculate CURE plot data
cure_df <- calculate_cure_dataframe(AADT, res)
#> Covariate: AADT

head(cure_df)
#> # A tibble: 6 × 5
#>    AADT residual  cumres  lower upper
#>   <dbl>    <dbl>   <dbl>  <dbl> <dbl>
#> 1 2363.   -233.   -233.   -457.  457.
#> 2 2435.     17.2  -216.   -459.  459.
#> 3 2724.    246.     29.9  -666.  666.
#> 4 2978.  -1539.  -1509.  -3081. 3081.
#> 5 3007.    -19.5 -1528.  -3081. 3081.
#> 6 3149.   -338.  -1867.  -3151. 3151.

## Providing CURE data frame
cure_plot(cure_df)
#> CURE data frame was provided. Its first column, AADT, will be used.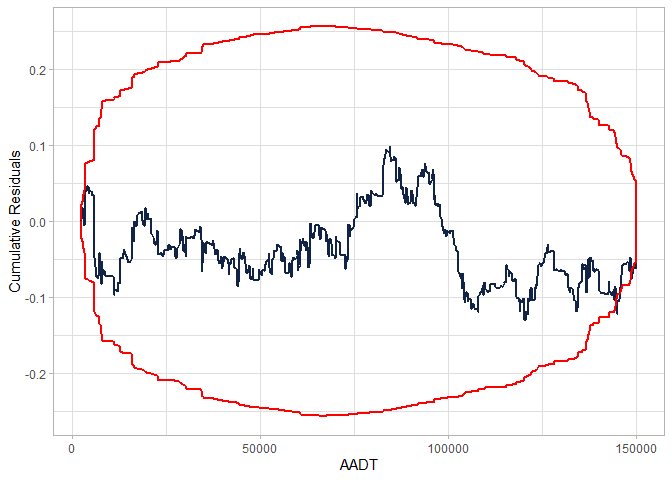
## Providing glm object
cure_plot(mod, "LNAADT")
#> Covariate LNAADT will be used to produce CURE plot.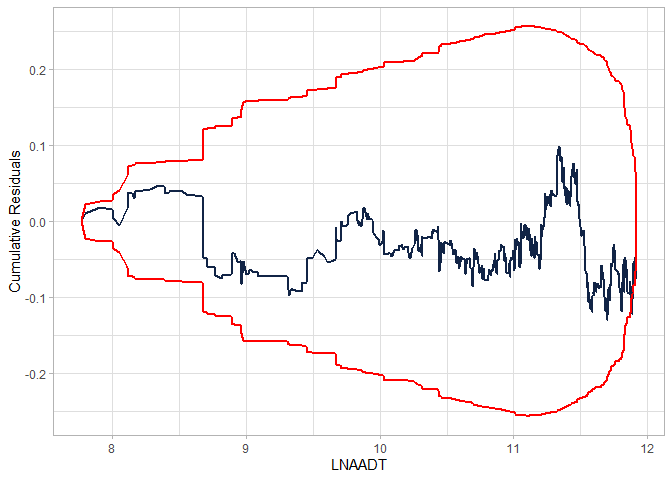
library(cureplots)

## Basic example

set.seed(2000)

## Define parameters.
beta <- c(-1, 0.3, 3)

## Simulate idependent variables
n <- 900
AADT <- c(runif(n, min = 2000, max = 150000))
nlanes <- sample(x = c(2, 3, 4), size = n, replace = TRUE)
LNAADT <- log(AADT)

## Simulate dependent variable
theta <- exp(beta[1] + beta[2] * LNAADT + beta[3] * nlanes)
y <- rpois(n, theta)

## Fit model
mod <- glm(y ~ LNAADT + nlanes, family = poisson)

## Calculate residuals
res <- residuals(mod, type = "response")

## Calculate CURE plot data
cure_df <- calculate_cure_dataframe(AADT, res)
#> Covariate: AADT


cure_plot(cure_df, n_resamples = 3)
#> CURE data frame was provided. Its first column, AADT, will be used.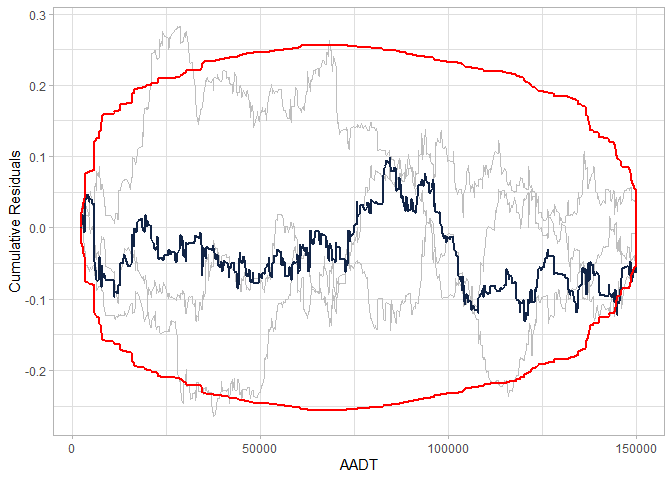
These binaries (installable software) and packages are in development.
They may not be fully stable and should be used with caution. We make no claims about them.
Health stats visible at Monitor.