
The hardware and bandwidth for this mirror is donated by dogado GmbH, the Webhosting and Full Service-Cloud Provider. Check out our Wordpress Tutorial.
If you wish to report a bug, or if you are interested in having us mirror your free-software or open-source project, please feel free to contact us at mirror[@]dogado.de.
cumulcalib provides non-parametric, tuning-parameter-free assessment of model calibration on the cumulative-sum domain, for two settings:
cumulcalib()
assesses the calibration of predicted risks (Sadatsafavi and Petkau
2024, https://doi.org/10.1002/sim.10138).cumulcalibITE() assesses the moderate calibration of
predicted treatment benefits using data from a randomized trial
(Sadatsafavi et al. 2026, https://doi.org/10.1002/sim.70724).The package comes with two tutorials (vignettes), which you can view after installing the package:
vignette("tutorial", package = "cumulcalib")     # risk prediction models
vignette("tutorialITE", package = "cumulcalib") # ITE modelsThe package can be installed from CRAN:
install.packages("cumulcalib")You can also install the development version, which includes the individualized treatment effect (ITE) functionality, from GitHub with:
# install.packages("remotes") #this package is necessary to connect to github
remotes::install_github("resplab/cumulcalib")library(cumulcalib)
set.seed(1)
p <- rbeta(1000, 1,5)
y <- rbinom(1000,1,p)
res <- cumulcalib(y, p)
summary(res)
#> Moderate calibration assessment of predicted risks
#> C_n (mean calibration error): 0.00532270104567871
#> C* (maximum cumulative calibration error): 0.00740996981029672 (observed risk < predicted)
#> Location of maximum cumulative error: time = 0.457280572542993, predicted risk = 0.217915058214255
#> Method: Two-part Brownian bridge (BB)
#> S_n (Z score for mean calibration error): 0.489295496431201
#> B* (test statistic for maximum absolute bridged calibration error): 0.904915434767163
#> Component-wise p-values: mean calibration=0.624632509005787 | Distance (bridged)=0.385979705481866
#> Combined p-value (Fisher's method): 0.584068794836004
plot(res)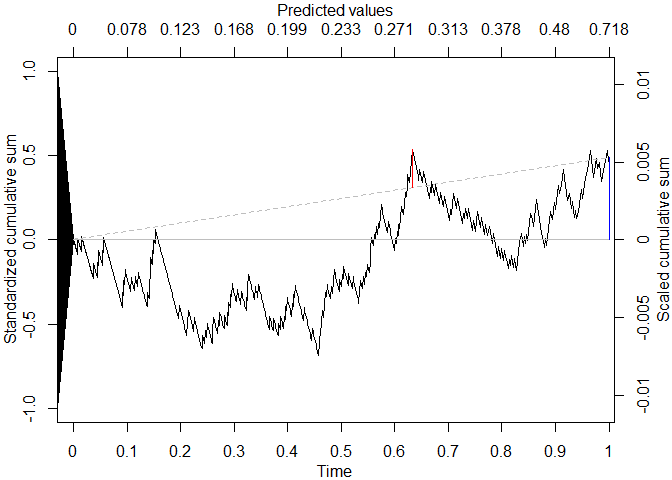
These binaries (installable software) and packages are in development.
They may not be fully stable and should be used with caution. We make no claims about them.
Health stats visible at Monitor.