The hardware and bandwidth for this mirror is donated by dogado GmbH, the Webhosting and Full Service-Cloud Provider. Check out our Wordpress Tutorial.
If you wish to report a bug, or if you are interested in having us mirror your free-software or open-source project, please feel free to contact us at mirror[@]dogado.de.
![]()
![]()
crosshap is an LD-based local haplotype analysis and
visualization tool.
Given a genomic variant data for a region of interest,
crosshap performs LD-based local haplotyping. Tightly
linked variants are clustered into Marker Groups (MGs), and individuals
are grouped into local haplotypes by shared allelic combinations of MGs.
Following this, crosshap provides a range of visualization
options to examine relevant characteristics of the linked Marker Groups
and local haplotypes.
crosshap was originally designed to explore local
haplotype patterns that may underlie phenotypic variability in
quantitative trait locus (QTL) regions. It is ideally suited to
complement and follow-up GWAS results (takes same inputs).
crosshap equips users with the tools to explain why a
region reported a GWAS hit, what variants are causal candidates, what
populations are they present/absent in, and what the features are of
those populations.
Alternatively, crosshap can simply be a tool to identify
patterns of linkage among local variants, and to classify individuals
based on shared haplotypes.
Note: crosshap is designed for in-depth, user-driven
analysis of inheritance patterns in specific regions of interest, not
genome-wide scans.
crosshap is available on CRAN:
install.packages("crosshap")For the latest features, you can install the development version of
crosshap from GitHub with:
# install.packages("devtools")
devtools::install_github("JacobIMarsh/crosshap")In short, a typical crosshap analysis workflow involves the following steps. For a detailed explanation and walk through, see our Getting started vignette.
read_vcf(region.vcf)
read_LD(plink.ld)
read_metadata(metadata.txt)
read_pheno(pheno.txt)HapObject <- run_haplotyping(vcf, LD, metadata, pheno, epsilon, MGmin)clustree_viz(HapObject)crosshap_viz(HapObject, epsilon)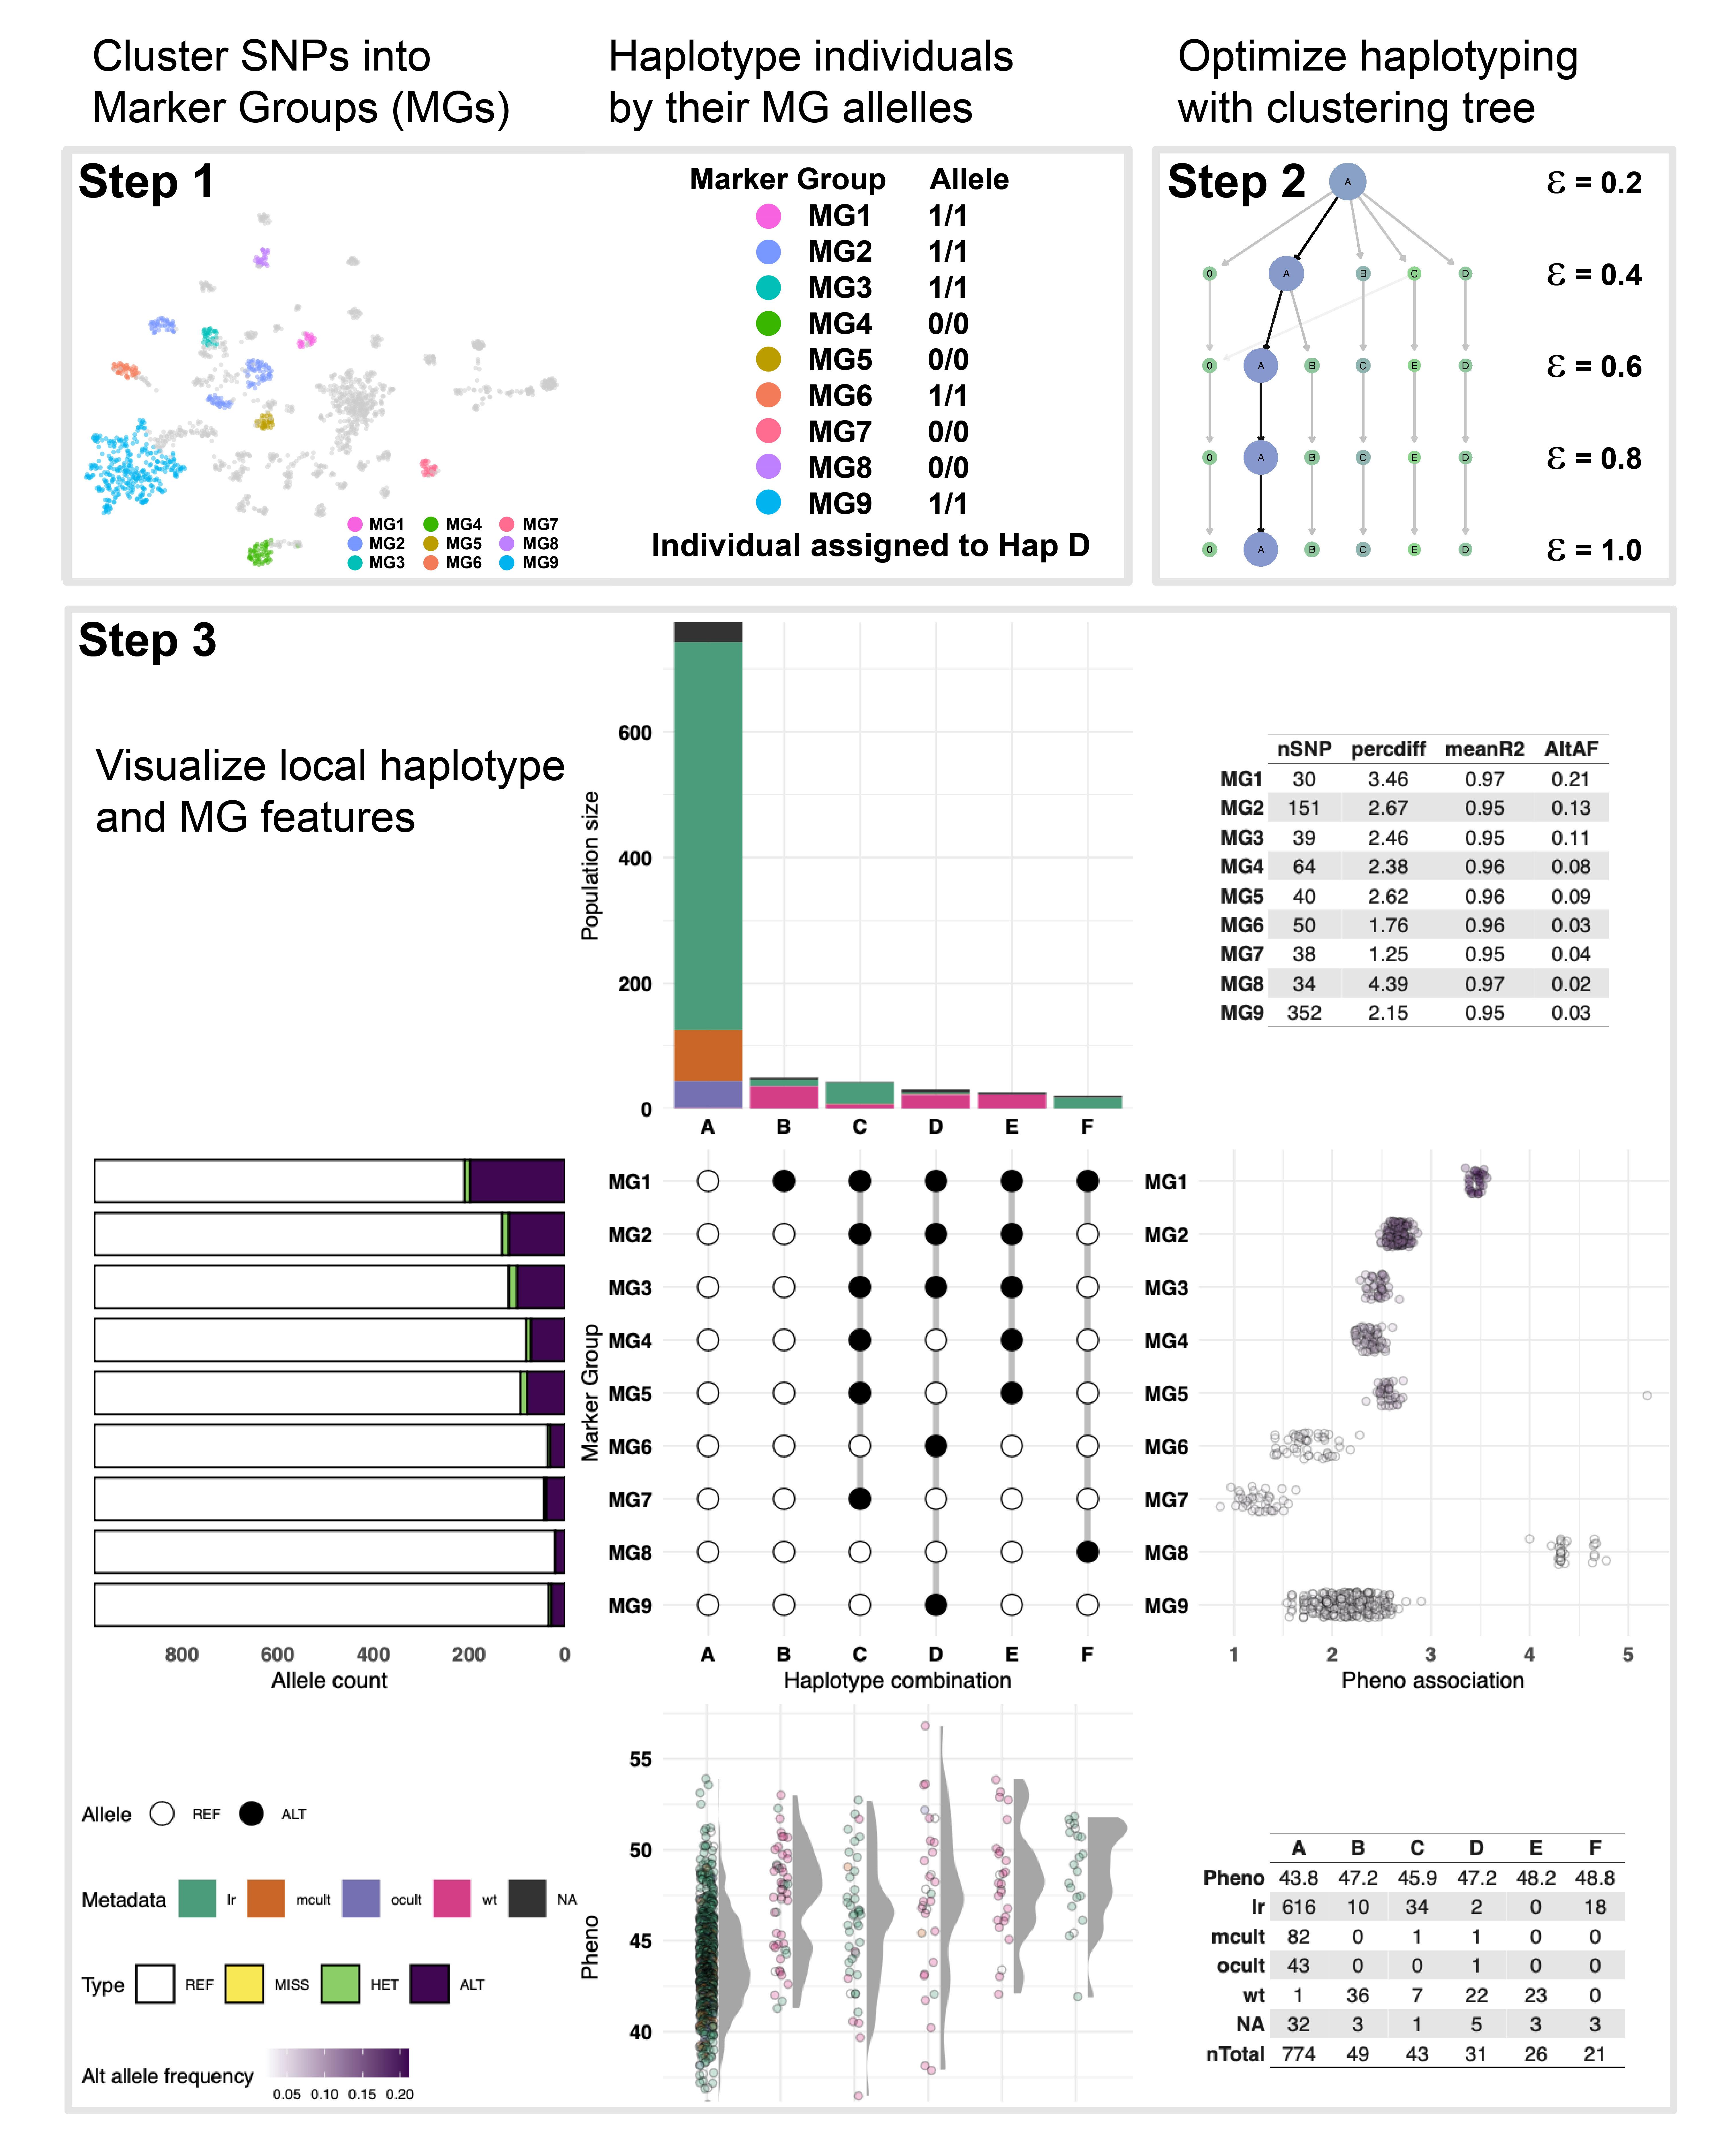
From here you can examine haplotype and Marker Group features from the visualization, and export relevant information from the haplotype object.
HapObject$Haplotypes_MGmin30_E0.6$Indfile
HapObject$Haplotypes_MGmin30_E0.6$Hapfile
HapObject$Haplotypes_MGmin30_E0.6$VarfileFor technical queries feel free to contact me: jacob.marsh@unc.edu . Please contact Prof. David Edwards for all other queries: dave.edwards@uwa.edu.au .
These binaries (installable software) and packages are in development.
They may not be fully stable and should be used with caution. We make no claims about them.
Health stats visible at Monitor.