
The hardware and bandwidth for this mirror is donated by dogado GmbH, the Webhosting and Full Service-Cloud Provider. Check out our Wordpress Tutorial.
If you wish to report a bug, or if you are interested in having us mirror your free-software or open-source project, please feel free to contact us at mirror[@]dogado.de.



coresynth is a high-performance R package that provides six causal inference methods for panel data through a unified formula interface. All core optimizations (QP solving, SVD, Kalman filtering) are implemented in C++ via RcppArmadillo, so estimation stays fast even on larger donor pools (see the Performance section for timings).
# From CRAN
install.packages("coresynth")

# Development version from GitHub
pak::pak("yo5uke/coresynth")coresynth fits causal panel models through a single formula
interface, y ~ d | id + time. This section walks through
the classic Synthetic Control Method (SCM); the same formula works for
five other methods (see Supported
Methods).
Your data should be a balanced panel in long format (one row per unit × time), with:
y — the outcome variabled — the treatment indicator: 0 normally,
1 for a treated unit in periods at or after its treatment
startsid — the unit identifiertime — the time identifierlibrary(coresynth)
# Generate a balanced panel (10 units, 20 periods, true ATT = 2.0)
set.seed(42)
N <- 10; TT <- 20; T_pre <- 10
f <- cumsum(rnorm(TT, 0, 0.5))
lam <- rnorm(N, 1, 0.3)
dat <- expand.grid(time = seq_len(TT), id = paste0("u", seq_len(N)))
dat$y <- as.vector(outer(f, lam)) + rnorm(nrow(dat), 0, 0.3)
dat$d <- as.integer(dat$id == "u1" & dat$time > T_pre) # u1 treated from t=11 on
dat$y[dat$d == 1] <- dat$y[dat$d == 1] + 2.0 # true ATT = 2
fit_scm <- scm_fit(y ~ d | id + time, data = dat, method = "scm")
summary(fit_scm)
#> === coresynth summary ===
#> Method : SCM
#> Periods : T_pre = 10 | T_post = 10
#> ATT estimate: 2.271136
#> Unit weights (non-zero donors):
#> u2 u4 u6 u7 u10
#> 0.2474 0.0705 0.1476 0.3279 0.2066The key arguments of scm_fit():
formula — y ~ d | id + time, matching the
columns abovedata — the long-format panelmethod — the estimator to use ("scm",
"sdid", "gsc", "mc",
"tasc", or "si"); all take the same
formulaMany more arguments are available for covariate adjustment, donor
selection, and staggered adoption — see the Covariates and Staggered Adoption sections below, or
?scm_fit.
# Observed vs. synthetic trend
plot(fit_scm, type = "trend")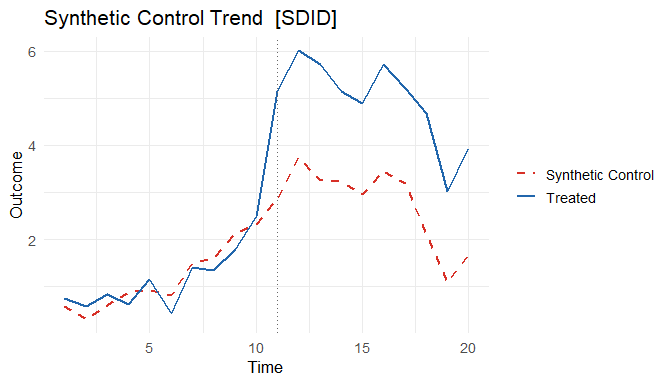
# Treatment effect over time
plot(fit_scm, type = "gap")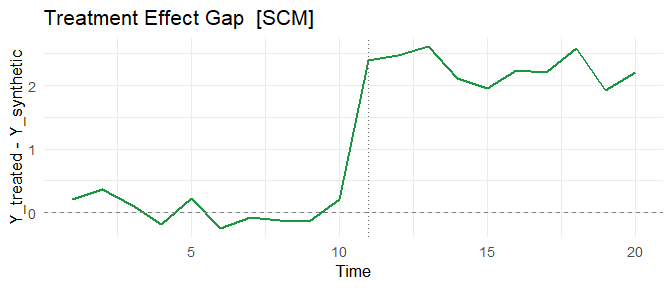
# Donor unit weights
plot(fit_scm, type = "weights")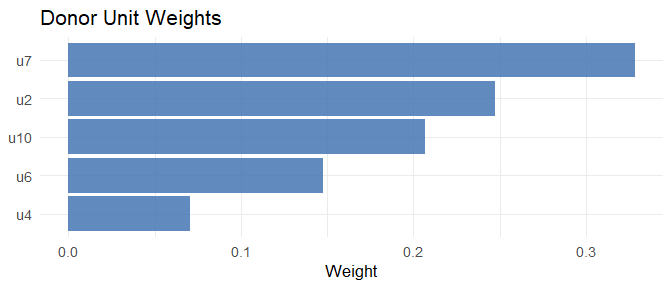
The same formula and data work for all six methods — just change
method:
methods <- c("scm", "sdid", "gsc", "mc", "tasc", "si")
fits    <- lapply(methods, \(m) scm_fit(y ~ d | id + time, data = dat, method = m))
names(fits) <- methods

# Compare ATT estimates (true value = 2.0)
data.frame(
  method   = methods,
  estimate = round(sapply(fits, `[[`, "estimate"), 3)
)
#>      method estimate
#> scm     scm    2.271
#> sdid   sdid    2.150
#> gsc     gsc    2.255
#> mc       mc    2.198
#> tasc   tasc    1.154
#> si si 2.393| Method | Full name | Reference | Treatment | Covariates | Inference |
|---|---|---|---|---|---|
scm |
Synthetic Control Method | Abadie, Diamond & Hainmueller (2010); staggered: Ben-Michael, Feller & Rothstein (2022) | Sharp & Staggered | pred() list |
mspe_ratio_pval(), scm_inference(),
conformal_inference() |
sdid |
Synthetic Difference-in-Differences | Arkhangelsky et al. (2021) | Sharp & Staggered | covariates= |
sdid_inference(),
conformal_inference() |
gsc |
Generalized Synthetic Control | Xu (2017) | Sharp & Staggered | covariates=
time-varying |
gsc_boot(), gsc_inference(),
conformal_inference() |
mc |
Matrix Completion | Athey et al. (2021) | Sharp & Staggered | — | conformal_inference() |
tasc |
Time-Aware Synthetic Control | Rho et al. (2026) | Sharp & Staggered | — | — |
si |
Synthetic Interventions | Agarwal et al. (2025) | Sharp, Staggered & Multi-arm | — | si_inference(), conformal_inference() |
conformal_inference() (Chernozhukov, Wüthrich & Zhu
2021) provides permutation-based p-values and confidence intervals for
sharp fits across
scm/sdid/gsc/mc/si.
All six methods support staggered adoption, and all aggregate the
cohort ATTs the same way (Clarke et al. 2024): with weights proportional
to N_treated × T_post. How each cohort ATT is obtained
differs by estimator family. scm, sdid,
gsc, and si fit every adoption cohort
separately. mc and tasc impute the
counterfactual instead, from a single fit whose observation mask already
blanks each treated unit from its own adoption date, so no
cohort-by-cohort refitting is needed; their cohorts share one donor set
and they take no control_group argument.
# u1: treated from t=11, u2: treated from t=16
dat_s        <- dat
dat_s$d      <- 0L
dat_s$d[dat_s$id == "u1" & dat_s$time > 10] <- 1L
dat_s$d[dat_s$id == "u2" & dat_s$time > 15] <- 1L
# u1 already carries the +2 from `dat`; give u2 the same effect
dat_s$y[dat_s$id == "u2" & dat_s$d == 1] <-
  dat_s$y[dat_s$id == "u2" & dat_s$d == 1] + 2.0

# All methods detect staggered timing automatically
fit_sdid <- scm_fit(y ~ d | id + time, data = dat_s, method = "sdid")
fit_gsc  <- scm_fit(y ~ d | id + time, data = dat_s, method = "gsc")
fit_mc   <- scm_fit(y ~ d | id + time, data = dat_s, method = "mc")
fit_si   <- scm_fit(y ~ d | id + time, data = dat_s, method = "si")

# Cohort-level estimates are accessible
fit_sdid$cohort_estimates
#>   cohort n_treated T_pre T_post estimate weight
#> 1     11         1    10     10     2.11  0.667
#> 2     16         1    15      5     2.16  0.333

# Donors are the never-treated units: a unit that adopts later would be
# treated itself during the earlier cohort's post-treatment windowThe original SCM targets a single treated unit, so its staggered extension deserves a note. coresynth follows Ben-Michael, Feller & Rothstein (2022): units adopting at the same time are averaged into one cohort (fully pooling within a cohort is justified by their theory, since the data-generating process cannot vary across units sharing one adoption time), and the cohort weight vectors are then chosen jointly rather than one at a time.
# Defaults: nu = "auto" (the paper's heuristic) and fixedeff = TRUE (an
# intercept shift, which demeans each unit by its own pre-treatment mean).
fit_pp <- scm_fit(y ~ d | id + time, data = dat_s, method = "scm")
fit_pp$pooling   # balance diagnostics: q_sep / q_pool vs. separate SCM

# nu in [0, 1] sets the pooling directly: 0 trades everything for per-cohort
# fit, 1 for the fit of the *average* placebo gap across cohorts, which
# anchors the aggregate ATT. The paper advises against both extremes.
# nu = "separate" is the per-cohort path, which keeps the V optimisation,
# donor filtering and penalty options the pooled solver has no room for.
scm_balance_frontier(fit_pp)   # the nu trade-off across a grid

# Leave-one-unit-out jackknife (BFR Appendix A.1): donors are resampled too
scm_inference(fit_pp)
pool_cohorts = FALSE gives each treated unit its own
weight vector instead (the paper’s Section 4 formulation), which is what
scm_rank_pval() needs. weights sets the mass
each treated unit carries in the aggregate ATT – a population or GDP
figure, following Abadie (2021, S.8).
pred()SCM supports covariate-based matching following Abadie et al. (2010)
S.2.3. Use pred(vars, times, op) to specify which variables
and time windows to include in the predictor matrix:
# Assume dat has extra columns: income, unemp
fit_scm_cov <- scm_fit(
  y ~ d | id + time,
  data   = dat,
  method = "scm",
  predictors = list(
    pred(c("income", "unemp"), 1:8),   # average income & unemp over pre-period
    pred("y", 5),                       # outcome at a specific pre-treatment year
    pred("y", 1:4, op = "mean")         # outcome averaged over early pre-period
  )
)
summary(fit_scm_cov)   # shows predictor balance table
Each pred() call aggregates one or more variables over a
time window using op = "mean" (default),
"median", or "sum". Multiple
pred() calls with different windows can be combined freely
in the list.
GSC supports time-varying covariate adjustment via the full EM
algorithm of Xu (2017). Pass a character vector of column names as
covariates:
# Assume dat has a time-varying column: gdp_growth
fit_gsc_cov <- scm_fit(
  y ~ d | id + time,
  data       = dat,
  method     = "gsc",
  r          = 2,
  covariates = "gdp_growth"
)
fit_gsc_cov$beta   # estimated beta coefficient(s)
The EM loop alternates between:
Treated unit loadings are estimated from covariate-demeaned
pre-treatment data per Xu (2017) Step 2. When
covariates = NULL (default), the plain 3-step SVD estimator
(\(\hat\beta = 0\)) is used.
mspe_ratio_pval() runs the in-space placebo study of
Abadie, Diamond & Hainmueller (2010): the intervention is reassigned
to each donor unit and the treated unit’s post/pre-treatment MSPE ratio
is compared against the placebo distribution. The result can be plotted
directly.
scm_p <- mspe_ratio_pval(fits$scm)
scm_p$p_value
#> [1] 0.1

# Treated gap vs. placebo gaps in the donor pool (ADH 2010, Figures 4-7)
plot(scm_p, type = "gaps")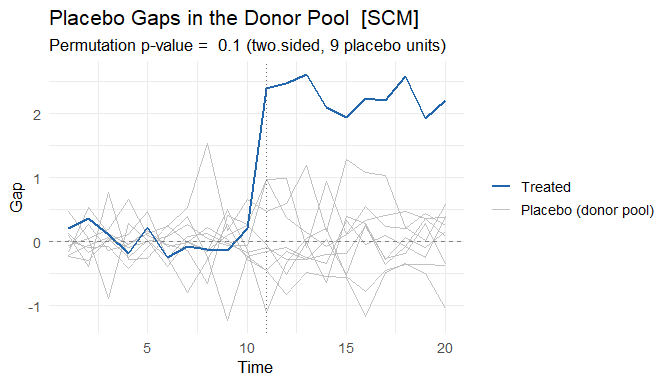
Placebo units with a poor pre-treatment fit can be pruned with
mspe_prune
(e.g. plot(scm_p, type = "gaps", mspe_prune = 5) excludes
units whose pre-treatment MSPE exceeds 5 times the treated unit’s).
# Post/pre-treatment MSPE ratio of every unit (ADH 2010, Figure 8)
plot(scm_p, type = "ratios")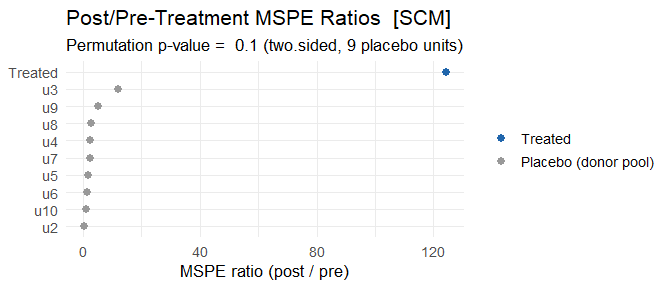
# SDID: four inference methods — placebo, bootstrap, jackknife, jackknife_global
sdid_inf <- sdid_inference(fits$sdid, method = "placebo")
tidy(sdid_inf)   # broom-style one-row data.frame

sdid_boot <- sdid_inference(fits$sdid, method = "bootstrap", n_boot = 200, seed = 1)
tidy(sdid_boot)

# GSC: parametric bootstrap under H0 (sharp only)
gsc_ci <- gsc_boot(fits$gsc, B = 200, alpha = 0.05)
cat("95% CI: [", gsc_ci$ci_lower, ",", gsc_ci$ci_upper, "]\n")

# GSC / SI: non-parametric inference (sharp + staggered)
gsc_inf <- gsc_inference(fits$gsc, method = "jackknife")
si_inf  <- si_inference(fits$si,  method = "bootstrap", n_boot = 200, seed = 1)
tidy(gsc_inf)
tidy(si_inf)

# Conformal inference (Chernozhukov, Wüthrich & Zhu 2021) — sharp fits for
# scm / sdid / gsc / mc / si. Re-estimates the counterfactual under the null
# and inverts a moving-block permutation test for a p-value and CI.
conf <- conformal_inference(fits$scm, tau0 = 0, level = 0.95)
tidy(conf)library(broom)
# Extract weights as a data frame
tidy(fits$scm)
# Summary row
glance(fits$scm)
# JSON export (for reproducibility and AI workflows)
export_json(fits$scm, file = "scm_result.json")Every plot() view also has a matching data extractor.
plot_data() returns the tidy data frame that a figure is
drawn from — taking the same type argument as
plot() — so you can rename the simplified series labels,
drop the numbers into a table, or build a bespoke figure with your own
code. plot() stays the quick path; plot_data()
is the handle when you want the data itself. For example, the
"trend" view:
head(plot_data(fits$scm, type = "trend"))
#>   time     value  series
#> 1    1 0.7590559 Treated
#> 2    2 0.5774968 Treated
#> 3    3 0.8414384 Treated
#> 4    4 0.6355518 Treated
#> 5    5 1.1532557 Treated
#> 6 6 0.4384856 TreatedOn a 100-donor, 10-year monthly panel, a full SCM fit and its in-space placebo test across all 100 donors both complete in well under a second; Synth takes over a minute for the fit alone, and about an hour and a half for the placebo test, on the same data and predictor specification (outcomes-only, matching solutions). Measured against Synth 1.1.10 on Windows 11 / R 4.6.1.
| Panel | Synth fit | coresynth fit | Synth placebo (all donors) | coresynth placebo (all donors) |
|---|---|---|---|---|
| 40 donors, 2 yr pre / 5 mo post | 5.8 s | 3 ms | 3.5 min | 12 ms |
| 100 donors, 8 yr pre / 2 yr post (monthly) | 70 s | 20 ms | ~97 min | 0.4 s |
These binaries (installable software) and packages are in development.
They may not be fully stable and should be used with caution. We make no claims about them.
Health stats visible at Monitor.