The hardware and bandwidth for this mirror is donated by dogado GmbH, the Webhosting and Full Service-Cloud Provider. Check out our Wordpress Tutorial.
If you wish to report a bug, or if you are interested in having us mirror your free-software or open-source project, please feel free to contact us at mirror[@]dogado.de.
![]()
![]()
![]()
![]()
{clinify} is direct extension of the {flextable} and {officer} packages, aimed at supplementing some functionality and simplifying some common tasks in the creation of clinical tables, listings, and figures.
You can install the development version of {clinify} like so:
install.packages("clinify")

# Install the development version:
devtools::install_github(
  "https://github.com/atorus-research/clinify.git",
  ref = "development"
)There’s a large assortment of table packages available, and many are specifically catered to clinical reporting. For many organizations, one of these packages may very well be a great choice, but there are a couple of key motivators we’ve found that drove us to start writing {clinify}:
Instead of building a new package from the ground up, {clinify} aims to extend what we see as a best choice for the situation at hand, adding new functionality where necessary and streamlining common tasks to make them more efficient for programmers to implement. We chose {flextable} for a two key reasons:
{flextable} already offers most of the functionality that we’re looking for, particularly with the pairing of {officer}. For example, word documents have to be a first class priority of output support.
While creating a table is the focus, the output tends to be more than just a table. We need the capability to modify the underlying document as a whole, which is another place that {officer} is truly necessary.
Here are some key principles we’re using in building {clinify}:
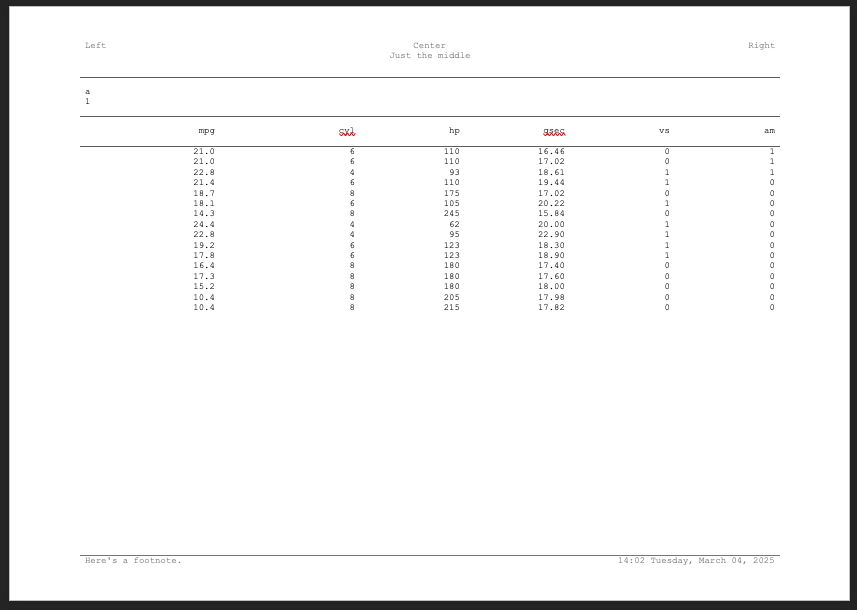
Here’s a basic example of some of clinify’s benefit in action
library(clinify)
# Mock some data
dat <- mtcars
dat["page"] <- c(
  rep(1, 10),
  rep(2, 10),
  rep(3, 10),
  c(4, 4)
)
dat2 <- rbind(dat, dat)
dat2["groups"] <- c(
  rep("a", 32),
  rep("b", 32)
)

# Create a basic table
ct <- clintable(dat2) |>
  # Break pages by the "page" variable
  clin_page_by("page") |>
  # Add header lines using the "groups" variable
  clin_group_by("groups") |>
  # For overflowing columns, alternate pages with
  # fixed variables for each page
  clin_alt_pages(
    key_cols = c("mpg", "cyl", "hp"),
    col_groups = list(
      c("disp", "drat", "wt"),
      c("qsec", "vs", "am"),
      c("gear", "carb")
    )
  ) |>
  # Apply column widths as a proportion of the total page
  # For alternating pages, the proportion allocated to key columns
  # is carried to each page group
  clin_col_widths(mpg = .2, cyl = .2, disp = .15, vs = .15) |>
  # Add titles here is using new_header_footer to allow flextable functions
  # to customize the titles block
  clin_add_titles(
    list(
      c("Left", "Right"),
      c("Just the middle")
    )
  ) |>
  clin_add_footnotes(
    list(
      c(
        "Here's a footnote.",
        format(Sys.time(), "%H:%M %A, %B %d, %Y")
      )
    )
  )

# Print pages (by default 3 pages) to the viewer of the IDE
print(ct)
Built off {flextable} and {officer}, you can then write the table out to a docx file.
# Write the table out to docx
write_clindoc(ct, "demo_table.docx")
These binaries (installable software) and packages are in development.
They may not be fully stable and should be used with caution. We make no claims about them.
Health stats visible at Monitor.