The hardware and bandwidth for this mirror is donated by dogado GmbH, the Webhosting and Full Service-Cloud Provider. Check out our Wordpress Tutorial.
If you wish to report a bug, or if you are interested in having us mirror your free-software or open-source project, please feel free to contact us at mirror[@]dogado.de.
The goal of ceramic is to obtain web map tiles. Use a spatial object to define the region of interest.
library(ceramic)
#> Loading required package: terra
#> terra 1.7.65
roi <- ext(100, 160, -50, 10)
im <- cc_location(roi)

plotRGB(im)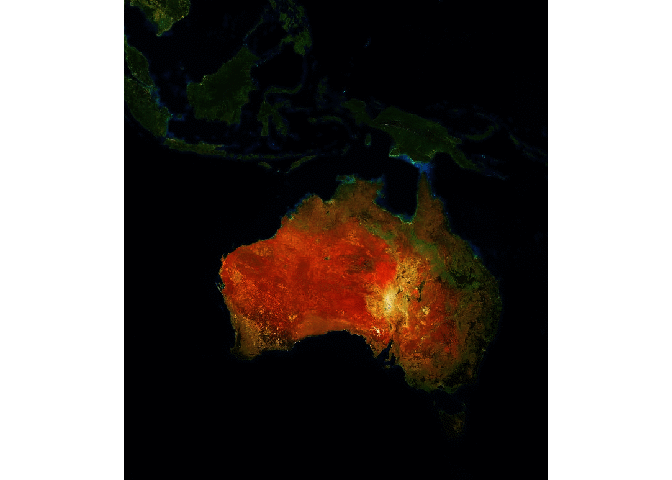
The terra package is always loaded by ceramic, so we can assume the use of its functions, ceramic accepts a wider range of inputs than terra does however.
We can use wk, geos, terra, raster, sp, sf, or stars objects, or an input lon,lat point and a buffer (in metres) to define an extent. This provides a very easy way to obtain imagery or elevation data for any almost any region using our own data.
sql <- "SELECT shapeGroup FROM geoBoundariesCGAZ_ADM0 WHERE shapeGroup IN ('BOL')"
dsn <- "/vsizip//vsicurl/https://github.com/wmgeolab/geoBoundaries/raw/main/releaseData/CGAZ/geoBoundariesCGAZ_ADM0.zip"
bol <- vect(dsn, query = sql)

im <- cc_location(bol)
plotRGB(im)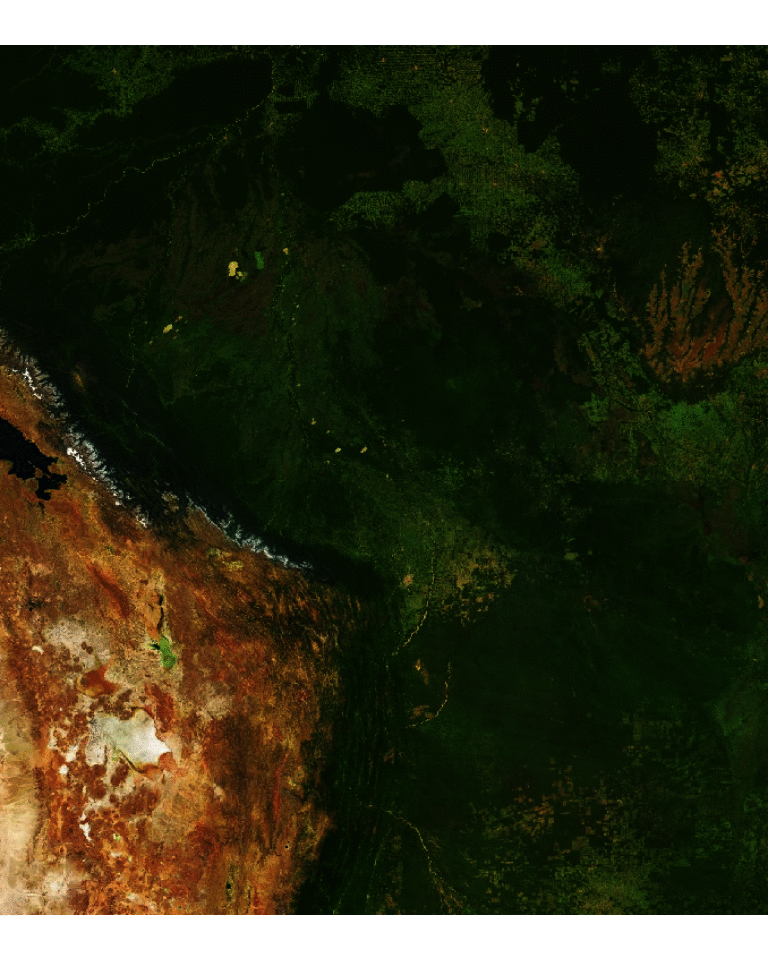
Even if the data uses a map projection it will be converted into a region to match the Mercator extents used by Mapbox image servers.
There are basic heuristics to decide if data is projected or just in “longitude,latitude” in the usual way.
Raster elevation data is also available.
north <- nz[nz$Island == "North", ]
dem_nz <- cc_elevation(north, type = "elevation-tiles-prod" )


## plot elevation data for NZ north
dem_nz[!dem_nz > 0] <- NA

plot(dem_nz, col = grey.colors(128))
plot(st_transform(st_cast(north, "MULTILINESTRING")["Name"], terra::crs(dem_nz)), add = TRUE, lwd = 5)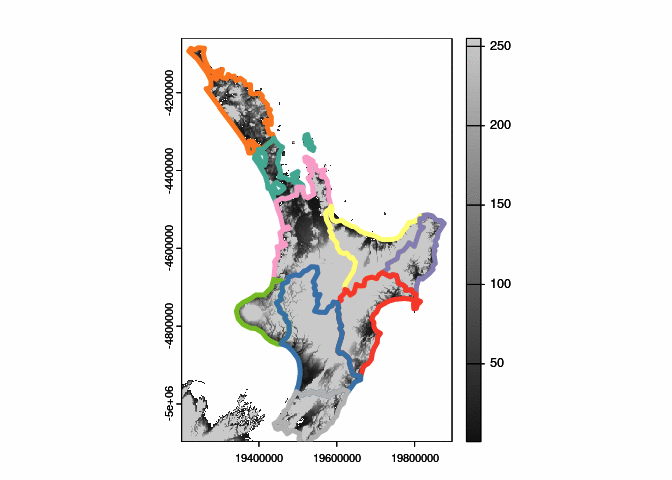
Indeed, here’s a function called read_tiles(), it shares
the same interface as get_tiles().
read_tiles()
#> Preparing to download: 1 tiles at zoom = 0 from
#> https://api.mapbox.com/v4/mapbox.satellite/
#> class       : SpatRaster
#> dimensions  : 256, 256, 3  (nrow, ncol, nlyr)
#> resolution  : 156543, 156543  (x, y)
#> extent      : -20037508, 20037508, -20037508, 20037508  (xmin, xmax, ymin, ymax)
#> coord. ref. : +proj=merc +lon_0=0 +k=1 +x_0=0 +y_0=0 +R=6378137 +units=m +no_defs
#> source      : 0.jpg
#> colors RGB  : 1, 2, 3
#> names       : 0_1, 0_2, 0_3
Note that, the cc_location() and
cc_elevation() functions no longer use tiles, they read
directly from the internet using GDAL and are not related to the tile
download facilities.
But, they used to run get_tiles() behind the scenes. The
separation is still a little unfinished, but I want ceramic to have
separation of loading data from the internet with downloading tiles.
This function and its counterparts get_tiles_zoom(),
get_tiles_dim() and get_tiles_buffer() will
only download files.
tile_summ <- get_tiles_zoom(north, zoom = 8)
#> Preparing to download: 48 tiles at zoom = 8 from
#> https://api.mapbox.com/v4/mapbox.satellite/
length(tile_summ$files)
#> [1] 48
str(tile_summ$tiles)
#> List of 2
#>  $ tiles:'data.frame':   48 obs. of  2 variables:
#>   ..$ x: int [1:48] 250 251 252 253 254 255 250 251 252 253 ...
#>   ..$ y: int [1:48] 153 153 153 153 153 153 154 154 154 154 ...
#>   ..- attr(*, "out.attrs")=List of 2
#>   .. ..$ dim     : Named int [1:2] 6 8
#>   .. .. ..- attr(*, "names")= chr [1:2] "x" "y"
#>   .. ..$ dimnames:List of 2
#>   .. .. ..$ x: chr [1:6] "x=250" "x=251" "x=252" "x=253" ...
#>   .. .. ..$ y: chr [1:8] "y=153" "y=154" "y=155" "y=156" ...
#>  $ zoom : num 8
#>  - attr(*, "class")= chr "tile_grid"

(tile_rect <- tiles_to_polygon(ceramic_tiles(zoom = 8)))
#> <wk_rct[78] with CRS=EPSG:3857>
#>  [1] [15028131 -3600490 15184674 -3443947] [15028131 -3757033 15184674 -3600490]
#>  [3] [15028131 -3913576 15184674 -3757033] [15028131 -4070119 15184674 -3913576]
#>  [5] [15028131 -4226662 15184674 -4070119] [15028131 -4383205 15184674 -4226662]
#>  [7] [15028131 -4539748 15184674 -4383205] [15184674 -3600490 15341217 -3443947]
#>  [9] [15184674 -3757033 15341217 -3600490] [15184674 -3913576 15341217 -3757033]
#> [11] [15184674 -4070119 15341217 -3913576] [15184674 -4226662 15341217 -4070119]
#> [13] [15184674 -4383205 15341217 -4226662] [15184674 -4539748 15341217 -4383205]
#> [15] [15967389 -4539748 16123932 -4383205] [15967389 -4696291 16123932 -4539748]
#> [17] [15967389 -4852834 16123932 -4696291] [16123932 -4539748 16280476 -4383205]
#> [19] [16123932 -4696291 16280476 -4539748] [16123932 -4852834 16280476 -4696291]
#> [21] [16123932 -5009377 16280476 -4852834] [16123932 -5165920 16280476 -5009377]
#> [23] [16280476 -4539748 16437019 -4383205] [16280476 -4696291 16437019 -4539748]
#> [25] [16280476 -4852834 16437019 -4696291] [16280476 -5009377 16437019 -4852834]
#> [27] [16280476 -5165920 16437019 -5009377] [16437019 -4852834 16593562 -4696291]
#> [29] [16437019 -5009377 16593562 -4852834] [16437019 -5165920 16593562 -5009377]
#> [31] [19098250 -4070119 19254793 -3913576] [19098250 -4226662 19254793 -4070119]
#> [33] [19098250 -4383205 19254793 -4226662] [19098250 -4539748 19254793 -4383205]
#> [35] [19098250 -4696291 19254793 -4539748] [19098250 -4852834 19254793 -4696291]
#> [37] [19098250 -5009377 19254793 -4852834] [19098250 -5165920 19254793 -5009377]
#> [39] [19254793 -4070119 19411336 -3913576] [19254793 -4226662 19411336 -4070119]
#> [41] [19254793 -4383205 19411336 -4226662] [19254793 -4539748 19411336 -4383205]
#> [43] [19254793 -4696291 19411336 -4539748] [19254793 -4852834 19411336 -4696291]
#> [45] [19254793 -5009377 19411336 -4852834] [19254793 -5165920 19411336 -5009377]
#> [47] [19411336 -4070119 19567879 -3913576] [19411336 -4226662 19567879 -4070119]
#> [49] [19411336 -4383205 19567879 -4226662] [19411336 -4539748 19567879 -4383205]
#> [51] [19411336 -4696291 19567879 -4539748] [19411336 -4852834 19567879 -4696291]
#> [53] [19411336 -5009377 19567879 -4852834] [19411336 -5165920 19567879 -5009377]
#> [55] [19567879 -4070119 19724422 -3913576] [19567879 -4226662 19724422 -4070119]
#> [57] [19567879 -4383205 19724422 -4226662] [19567879 -4539748 19724422 -4383205]
#> [59] [19567879 -4696291 19724422 -4539748] [19567879 -4852834 19724422 -4696291]
#> [61] [19567879 -5009377 19724422 -4852834] [19567879 -5165920 19724422 -5009377]
#> [63] [19724422 -4070119 19880965 -3913576] [19724422 -4226662 19880965 -4070119]
#> [65] [19724422 -4383205 19880965 -4226662] [19724422 -4539748 19880965 -4383205]
#> [67] [19724422 -4696291 19880965 -4539748] [19724422 -4852834 19880965 -4696291]
#> [69] [19724422 -5009377 19880965 -4852834] [19724422 -5165920 19880965 -5009377]
#> [71] [19880965 -4070119 20037508 -3913576] [19880965 -4226662 20037508 -4070119]
#> [73] [19880965 -4383205 20037508 -4226662] [19880965 -4539748 20037508 -4383205]
#> [75] [19880965 -4696291 20037508 -4539748] [19880965 -4852834 20037508 -4696291]
#> [77] [19880965 -5009377 20037508 -4852834] [19880965 -5165920 20037508 -5009377]
This is really for expert use when you want to control the downloaded tile files yourself directly.
The default map provider is Mapbox, but ceramic is written for
general usage and also provides access to the joerd AWS tiles via the
type = "elevation-tiles-prod" argument.
pt <- cbind(175.6082, -37.994)
nz_z12 <- cc_location(pt, buffer = 100000, type = "elevation-tiles-prod")Install ceramic from CRAN with:
install.packages("ceramic")You can install the development version of ceramic from Github.
## install.packages("remotes")
remotes::install_github("hypertidy/ceramic")
Set your mapbox API key with
Sys.setenv(MAPBOX_API_KEY = "<yourkey>")This complete example gets tiled imagery that we can use as real data.
The code here
then we look at the actual tiles involved,
library(ceramic)
## a point in longlat, and a buffer with in metres
pt <- cbind(136, -34)
im <- cc_location(pt, buffer = c(1e6, 5e5), type = "mapbox.satellite")
op <- par(bg = "black")
plotRGB(im)

## get the approximately matching tiles (zoom is magic here, it's all wrapped - needs thought)

tileset <- get_tiles(pt, buffer = c(1e6, 5e5))
#> Preparing to download: 28 tiles at zoom = 7 from
#> https://api.mapbox.com/v4/mapbox.satellite/
tiles <- ceramic_tiles(zoom = tileset$tiles$zoom, type = "mapbox.satellite")
plot(tiles_to_polygon(tiles), add = TRUE, border = "white")


middle <- function(x, y) {
  x + (y - x)/2
}
text(middle(tiles$xmin, tiles$xmax), middle(tiles$ymin, tiles$ymax), lab = sprintf("[%i,%i]", tiles$tile_x, tiles$tile_y),
     col = "yellow")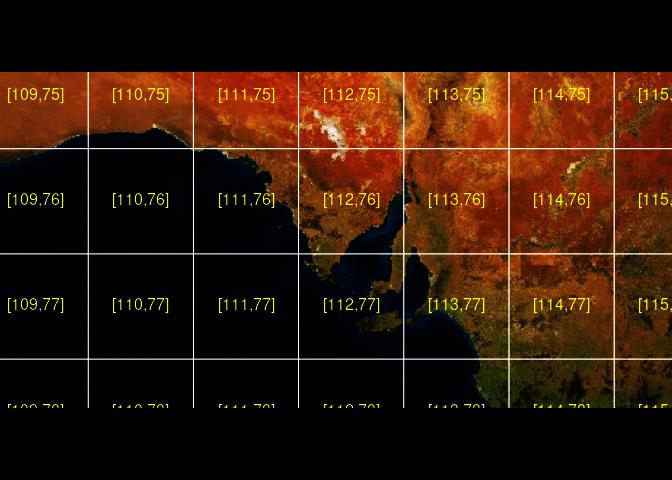
par(op)library(ceramic)
library(terra)
template <- rast(ext(527358, 527880, 5252204, 5252704), res = .3, crs = "EPSG:32755")
ortho <- cc_location(template, type = "tasmap_orthophoto")
plot(ortho)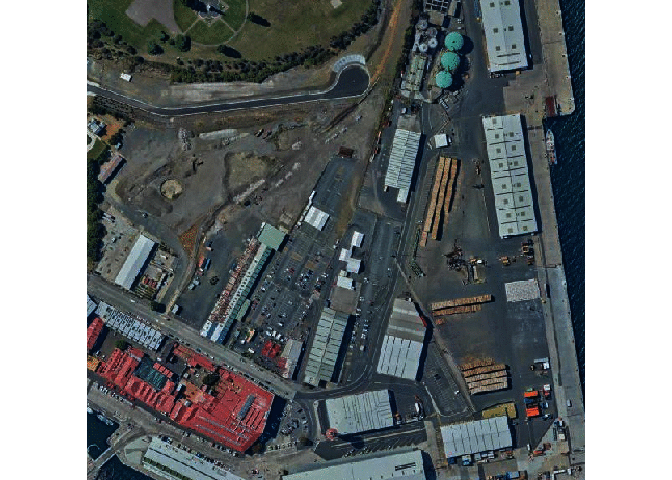
plot(cc_location(template, type = "tasmap_street"))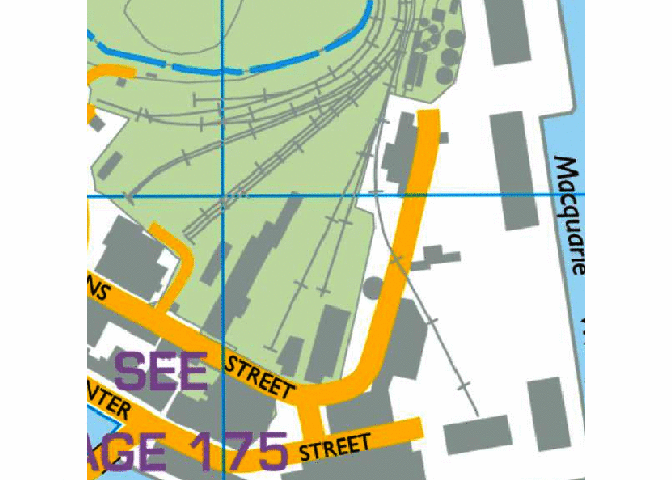
plot(cc_location(template, type = "tasmap_tasmapraster"))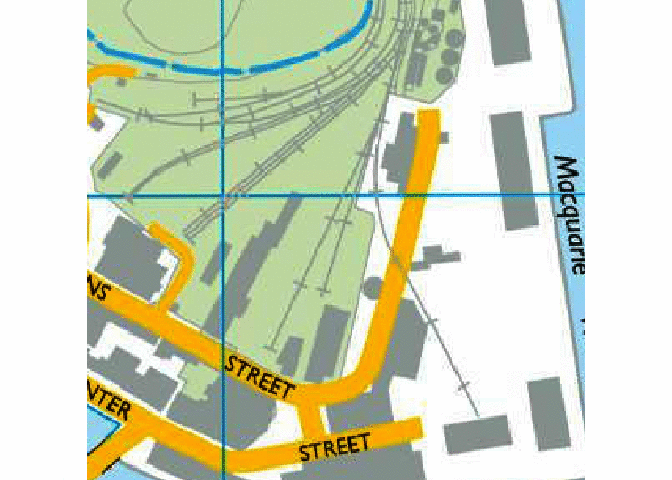
plot(cc_location(template, type = "tasmap_hillshade"))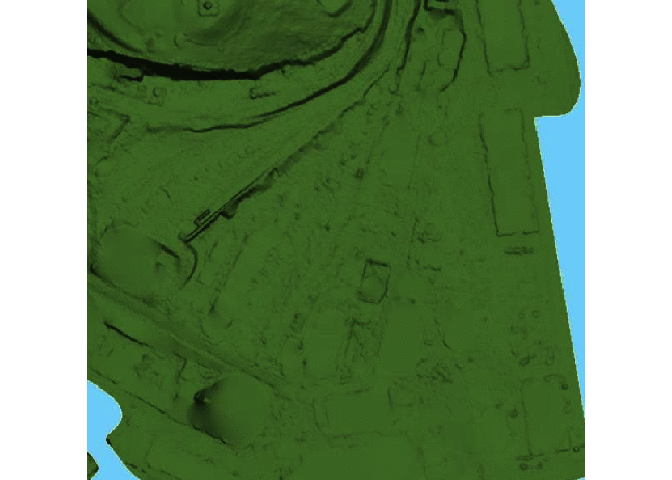
plot(cc_location(template, type = "tasmap_hillshadegrey"))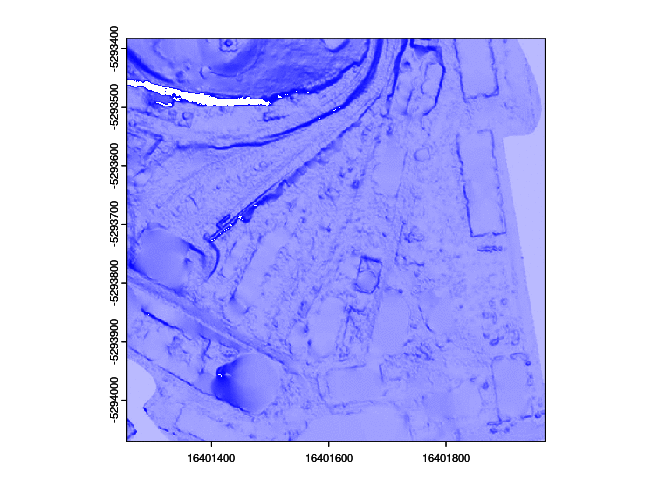
plot(cc_location(template, type = "tasmap_esgismapbookpublic")) ## nope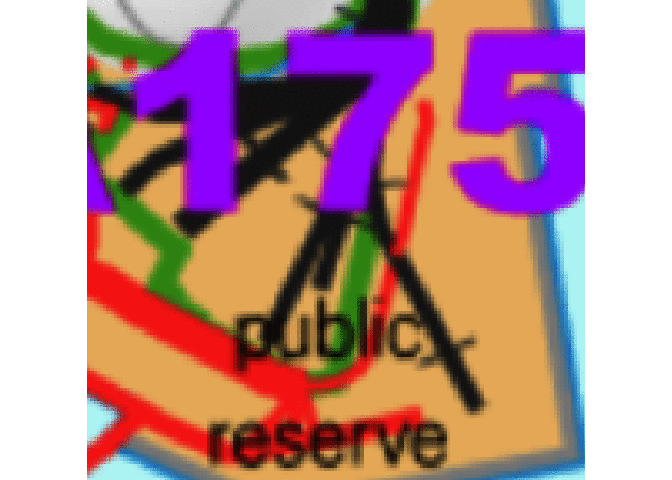
plot(cc_location(template, type = "tasmap_topographic"))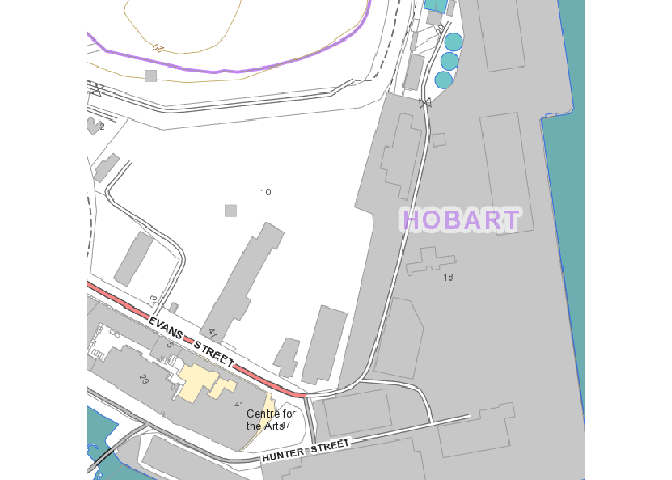
plot(cc_location(template, type = "tasmap_tasmap25k")) ## also 100k, 250k, 500k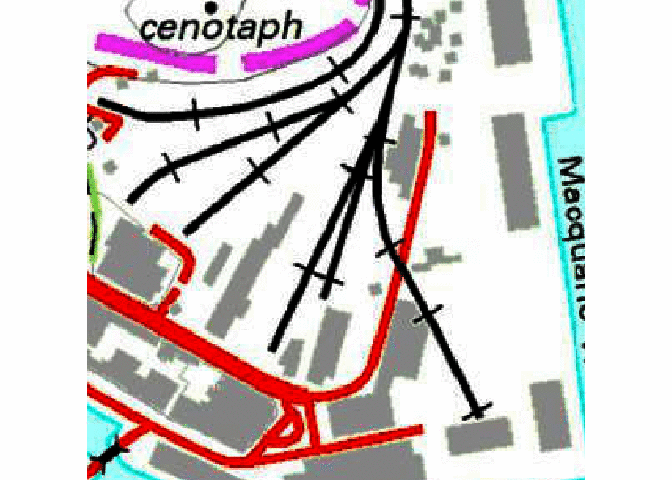
Please note that the ‘ceramic’ project is released with a Contributor Code of Conduct. By contributing to this project, you agree to abide by its terms.
These binaries (installable software) and packages are in development.
They may not be fully stable and should be used with caution. We make no claims about them.
Health stats visible at Monitor.