The hardware and bandwidth for this mirror is donated by dogado GmbH, the Webhosting and Full Service-Cloud Provider. Check out our Wordpress Tutorial.
If you wish to report a bug, or if you are interested in having us mirror your free-software or open-source project, please feel free to contact us at mirror[@]dogado.de.
cacc:
Conjunctive Analysis of Case Configurations![]()
![]()
An R Package to compute Conjunctive Analysis of Case Configurations (CACC), Situational Clustering Tests, and Main Effects
A set of functions to conduct Conjunctive Analysis of Case Configurations (CACC) (Miethe, Hart & Regoeczi, 2008), to identify and quantify situational clustering in dominant case configurations (Hart, 2019), and to determine the main effects of specific variable values on the probabilities of outcome (Hart, Rennison & Miethe, 2017). Initially conceived as an exploratory technique for multivariate analysis of categorical data, CACC has developed to include formal statistical tests that can be applied in a wide variety of contexts. This technique allows examining composite profiles of different units of analysis in an alternative way to variable-oriented methods.
To install cacc, you can run:
# Install {cacc} from CRAN
install.packages("cacc")
You can also install the development version of cacc from GitHub with:
# Check if the `devtools` package needs to be installed
if (!require("devtools")) install.package("devtools")

# Install {cacc} from GitHub
devtools::install_github("amoneva/cacc")# Load {cacc} and the {tidyverse}
library(cacc)
library(tidyverse)
#> ── Attaching core tidyverse packages ──────────────────────── tidyverse 2.0.0 ──
#> ✔ dplyr 1.1.4 ✔ readr 2.1.5
#> ✔ forcats 1.0.0 ✔ stringr 1.5.1
#> ✔ ggplot2 3.5.1 ✔ tibble 3.2.1
#> ✔ lubridate 1.9.3 ✔ tidyr 1.3.1
#> ✔ purrr 1.0.2
#> ── Conflicts ────────────────────────────────────────── tidyverse_conflicts() ──
#> ✖ dplyr::filter() masks stats::filter()
#> ✖ dplyr::lag() masks stats::lag()
#> ℹ Use the conflicted package (<http://conflicted.r-lib.org/>) to force all conflicts to become errors# Explore the dataset
onharassment |> glimpse()
#> Rows: 4,174
#> Columns: 12
#> $ sex <fct> male, male, male, female, female, female, male, female, m…
#> $ age <fct> 15-17, 18-21, 18-21, 18-21, 18-21, 15-17, 12-14, 12-14, 1…
#> $ hours <fct> 4-7, 4-7, 4-7, 4-7, 4-7, 4-7, <4, 4-7, 4-7, 4-7, <4, <4, …
#> $ snapchat <fct> yes, no, no, yes, no, yes, yes, yes, no, no, no, no, no, …
#> $ instagram <fct> yes, yes, yes, yes, yes, yes, yes, yes, yes, yes, no, yes…
#> $ facebook <fct> no, no, no, yes, no, no, no, no, no, no, no, no, no, no, …
#> $ twitter <fct> yes, yes, no, yes, no, no, no, no, no, yes, no, no, no, n…
#> $ name <fct> no, yes, no, no, yes, yes, yes, yes, yes, yes, no, yes, n…
#> $ photos <fct> no, no, no, no, no, yes, yes, yes, yes, yes, no, no, no, …
#> $ privacy <fct> no, no, no, no, no, no, no, no, no, no, no, no, no, no, n…
#> $ rep_victim <fct> 0, 0, 1, 1, 0, 1, 0, 1, 1, 0, 1, 0, 0, 0, 1, 1, 1, 0, 1, …
#> $ rep_offender <fct> 0, 0, 0, 0, 0, 1, 0, 0, 1, 0, 0, 0, 0, 0, 1, 1, 1, 0, 0, …# Calculate the CACC matrix
cacc_matrix <- onharassment |>
cacc(
ivs = sex:privacy,
dv = rep_victim
)
#> Joining with `by = join_by(sex, age, hours, snapchat, instagram, facebook,
#> twitter, name, photos, privacy)`
# Look at the first few rows
cacc_matrix |> head()
#> # A tibble: 6 × 12
#> sex age hours snapchat instagram facebook twitter name photos privacy
#> <fct> <fct> <fct> <fct> <fct> <fct> <fct> <fct> <fct> <fct>
#> 1 female 15-17 4-7 yes yes no no yes yes no
#> 2 female 12-14 <4 no yes no no yes yes yes
#> 3 female 15-17 4-7 no yes no no yes yes no
#> 4 female 15-17 4-7 no yes no yes yes no no
#> 5 female 18-21 4-7 no yes no no no no yes
#> 6 female 18-21 4-7 no yes yes yes no no yes
#> # ℹ 2 more variables: freq <int>, p <dbl># Compute a Chi-Square Goodness-of-Fit Test
cacc_matrix |> cluster_xsq()
#>
#> Chi-squared test for given probabilities
#>
#> data: obs
#> X-squared = 3378.2, df = 93, p-value < 2.2e-16# Compute a Situational Clustering Index (SCI)
cacc_matrix |> cluster_sci()
#> [1] 0.4505963
# Plot a Lorenz Curve to visualize the SCI
cacc_matrix |> plot_sci()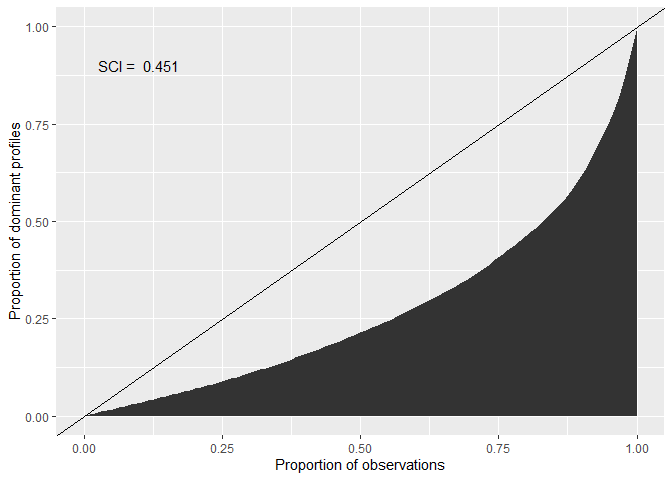
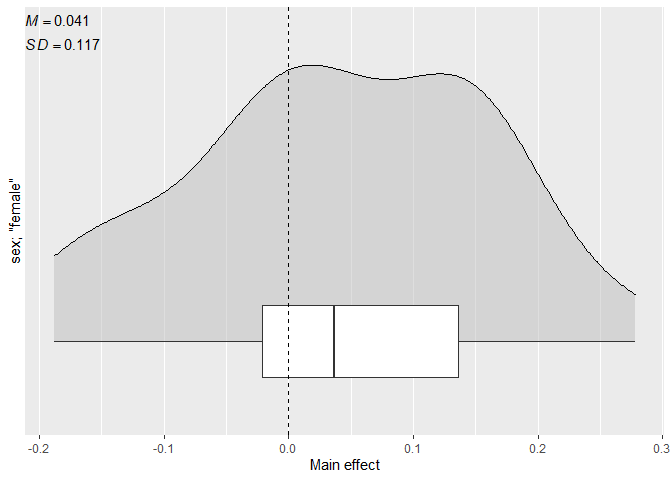
# Compute the main effects for a specific variable value
cacc_matrix |>
  main_effect(
    iv = sex,
    value = "female",
    # Set to `FALSE` for a numeric vector of effects
    summary = TRUE
  )
#> # A tibble: 1 × 5
#>   median  mean    sd    min   max
#>    <dbl> <dbl> <dbl>  <dbl> <dbl>
#> 1  0.037 0.041 0.117 -0.188 0.278

# Plot the distribution of the main effect
cacc_matrix |>
  plot_effect(
    iv = sex,
    value = "female"
  )
These binaries (installable software) and packages are in development.
They may not be fully stable and should be used with caution. We make no claims about them.
Health stats visible at Monitor.