The hardware and bandwidth for this mirror is donated by dogado GmbH, the Webhosting and Full Service-Cloud Provider. Check out our Wordpress Tutorial.
If you wish to report a bug, or if you are interested in having us mirror your free-software or open-source project, please feel free to contact us at mirror[@]dogado.de.
![]()
![]()
baselinr builds report-ready baseline
equivalence tables for impact evaluations in education
research, following the conventions of the What Works Clearinghouse (WWC).
Given a treatment indicator and a set of covariates, it reports the
appropriate standardized effect size — Hedges’ g for
continuous covariates, the Cox index for binary ones —
and the WWC equivalence category for each.
It is a thin, education-specific reporting layer. For general-purpose
covariate balance assessment, see cobalt;
baselinr focuses narrowly on the WWC equivalence categories
that education evaluation reports are required to state.
# install.packages("remotes")
remotes::install_github("zl1212-ship-it/baselinr")library(baselinr)
study <- data.frame(
treat = c(1, 1, 1, 0, 0, 0),
pretest = c(5, 6, 7, 4, 5, 6), # continuous -> Hedges' g
female = c(1, 0, 1, 0, 0, 1) # binary -> Cox index
)
knitr::kable(baseline_equivalence(study, treatment = "treat"), digits = 3)| covariate | type | n_treatment | n_comparison | mean_treatment | mean_comparison | sd_treatment | sd_comparison | effect_size | wwc_category |
|---|---|---|---|---|---|---|---|---|---|
| pretest | continuous | 3 | 3 | 6.000 | 5.000 | 1.000 | 1.000 | 0.80 | not_satisfied |
| female | binary | 3 | 3 | 0.667 | 0.333 | 0.577 | 0.577 | 0.84 | not_satisfied |
The WWC categories are:
| Effect size (absolute) | Category | Meaning |
|---|---|---|
<= 0.05 |
satisfied |
Baseline equivalence holds. |
0.05–0.25 |
satisfied_with_adjustment |
Holds only if the covariate is adjusted for in the impact model. |
> 0.25 |
not_satisfied |
Cannot establish equivalence. |
love_plot() shows the standardized effect size of every
covariate against the WWC thresholds (requires
ggplot2):
love_plot(baseline_equivalence(study, treatment = "treat"))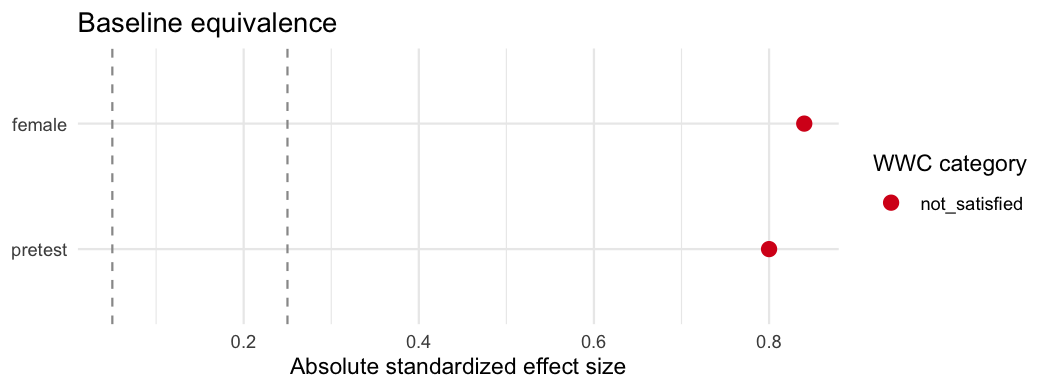
gt_baseline() renders the same table as a formatted
gt table for reports and Quarto/HTML (requires
gt):
gt_baseline(baseline_equivalence(study, treatment = "treat"))Continuous covariates use Hedges’ g (with the WWC small-sample
correction); binary covariates (numeric 0/1, logical, or
two-level factor) use the WWC Cox index. wwc_summary()
collapses the table into an overall verdict, and
attrition() reports overall and differential attrition. See
NEWS.md for the roadmap.
MIT © Yuxia Liang
These binaries (installable software) and packages are in development.
They may not be fully stable and should be used with caution. We make no claims about them.
Health stats visible at Monitor.