The hardware and bandwidth for this mirror is donated by dogado GmbH, the Webhosting and Full Service-Cloud Provider. Check out our Wordpress Tutorial.
If you wish to report a bug, or if you are interested in having us mirror your free-software or open-source project, please feel free to contact us at mirror[@]dogado.de.
A tidy and flexible framework for visualizing multivariate ordinations in R
![]()
![]()
barrel is an R package that enhances the visualization
of ordination analyses (e.g. NMDS, RDA, dbRDA) using
ggplot2. It provides a modular set of tools to add
ellipses, centroids, environmental vectors, and annotations — all
compatible with tidyverse workflows.
install.packages("barrel")# install.packages("devtools")
devtools::install_github("BarrancoElena/barrel")library(vegan)
library(barrel)
library(ggplot2)
data(dune)
data(dune.env)
ord <- metaMDS(dune)
ord <- barrel_prepare(ord, dune.env)
autoplot(ord, group = "Management", data = dune)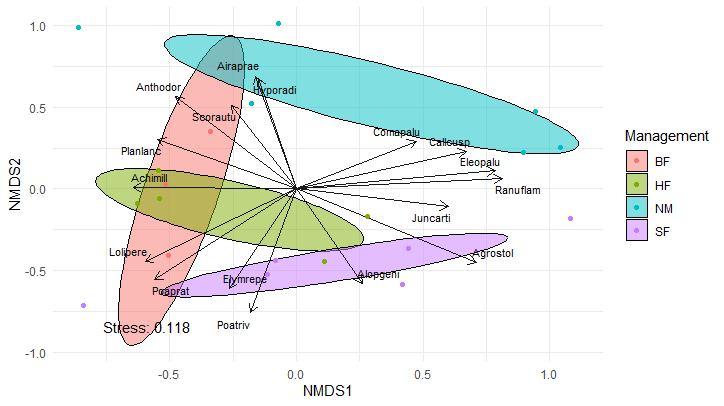
autoplot(): single-function plotting of NMDS, RDA,
dbRDA, CCA, etc.method = "classic" and
"robust" covariance estimationstat_barrel()), centroids
(stat_barrel_centroid()), vectors
(stat_barrel_arrows())stat_barrel_annotate()ggplot2 syntaxA full user guide is available:
browseVignettes("barrel")Diego Barranco-Elena
@BarrancoElena
MIT © 2025 Diego Barranco-Elena
These binaries (installable software) and packages are in development.
They may not be fully stable and should be used with caution. We make no claims about them.
Health stats visible at Monitor.