
The hardware and bandwidth for this mirror is donated by dogado GmbH, the Webhosting and Full Service-Cloud Provider. Check out our Wordpress Tutorial.
If you wish to report a bug, or if you are interested in having us mirror your free-software or open-source project, please feel free to contact us at mirror[@]dogado.de.


Analyze biodiversity trends and spatial patterns from GBIF data cubes, using flexible indicators like richness, evenness, and more.
Biodiversity researchers need robust and standardized tools to analyze the vast amounts of data available on platforms like GBIF. The b3gbi package leverages the power of data cubes to streamline biodiversity assessments. It helps researchers gain insights into:
b3gbi empowers biodiversity analysis with:
Install b3gbi in R:
install.packages("b3gbi", repos = c("https://b-cubed-eu.r-universe.dev", "https://cloud.r-project.org"))This basic example demonstrates the core workflow: preparing the data cube, calculating an indicator, and plotting the result as a spatial map of species richness for bryophytes in Montenegro.
# Load package
library(b3gbi)

# 1. Load and prepare the GBIF data cube
cube_name <- system.file("extdata", "montenegro_bryophytes_cube_eea.csv", package = "b3gbi")
bryophyte_data <- process_cube(cube_name)

# 2. Calculate a map of observed richness
map_rich_bryo <- obs_richness_map(bryophyte_data, level = "country", region = "Montenegro", ne_scale = "medium", cell_size = 10)

# 3. Plot the indicator map
plot(map_rich_bryo, title = "Observed Species Richness: Bryophytes in Montenegro")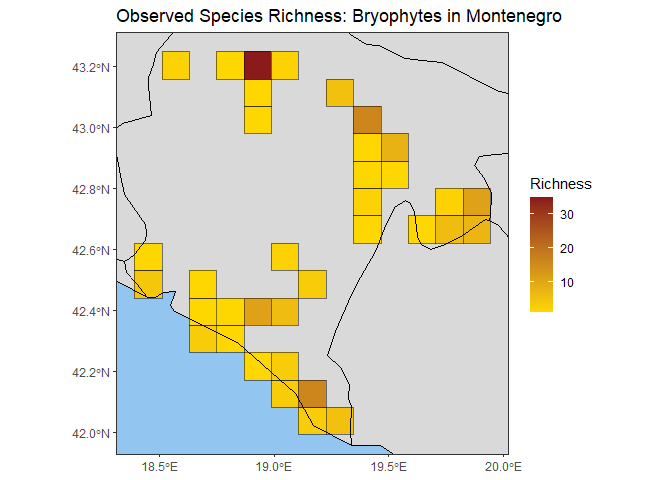
For a more in-depth introduction, see the tutorial: https://b-cubed-eu.github.io/b3gbi/articles/b3gbi.html.
These binaries (installable software) and packages are in development.
They may not be fully stable and should be used with caution. We make no claims about them.
Health stats visible at Monitor.