The hardware and bandwidth for this mirror is donated by dogado GmbH, the Webhosting and Full Service-Cloud Provider. Check out our Wordpress Tutorial.
If you wish to report a bug, or if you are interested in having us mirror your free-software or open-source project, please feel free to contact us at mirror[@]dogado.de.
Automatic codebook and eligibility tracking for data preprocessing pipelines in R.
Write the mutate() — the codebook writes
itself.
Built for large-scale epidemiological and social data pipelines using sparklyr, but works equally well with local data frames.
# From CRAN (after release)
install.packages("autocodebook")

# Development version
# install.packages("devtools")
devtools::install_github("patriciafortesm/autocodebook")In data preprocessing pipelines, documenting variables is
duplicated work. You already wrote the
case_when() with all the logic — but then you have to
manually write the type, the source columns, the category labels, and
the code again in a separate codebook table.
Before (manual codebook — you write everything twice):
# Step 1: Create the variable
df <- df %>%
  mutate(
    sex = case_when(
      cod_sex %in% c(0L, 99L) ~ NA_character_,
      cod_sex == 1L            ~ "Male",
      cod_sex == 2L            ~ "Female",
      TRUE                     ~ NA_character_
    )
  )

# Step 2: Manually document it (duplicated effort!)
register_var("sex",
  type       = "character",
  source     = "cod_sex",
  label      = "Sex",
  categories = "Male; Female; NA (codes 0 and 99)",
  code       = "case_when(cod_sex %in% c(0L, 99L) ~ NA_character_, ...)"
)
After (with autocodebook — you only write the label):
df <- auto_mutate(df,
  labels = list(sex = "Sex"),
  sex = case_when(
    cod_sex %in% c(0L, 99L) ~ NA_character_,
    cod_sex == 1L            ~ "Male",
    cod_sex == 2L            ~ "Female",
    TRUE                     ~ NA_character_
  )
)
# Done. Type, source, categories, and code are captured automatically.
The package uses introspection (rlang) to capture the
source code of each expression and infer:
| Field | How it’s inferred |
|---|---|
type |
Keywords in the code (NA_character_, 0L,
/) |
source |
Column names referenced in the expression |
categories |
Literal values extracted from case_when /
if_else |
code |
The literal R expression, captured automatically |
| Field | Who fills it | Example |
|---|---|---|
label |
You | "Sex", "Household crowding" |
block |
You (optional) | "Demographics", "Migration" |
type |
Automatic | "character", "integer",
"date" |
source |
Automatic | "cod_sex", "n_people, n_rooms" |
categories |
Automatic | "Male; Female; NA" |
code |
Automatic | The full case_when(...) expression |
library(dplyr)
library(autocodebook)

cb_init(id_col = "person_id")

df <- df %>%
  # Track raw data
  auto_filter(step = "1. Raw data", description = "All records", TRUE) %>%
  # Eligibility
  auto_filter(step = "2. Valid sex",
              description = "Exclude records with missing sex",
              !is.na(cod_sex)) %>%
  auto_filter(step = "3. Adults",
              description = "Restrict to age >= 18",
              age >= 18) %>%
  # Create derived variables (auto-documented)
  auto_mutate(
    labels = list(
      sex      = "Sex",
      race     = "Self-declared race / ethnicity",
      crowding = "Household crowding (people per room)"
    ),
    block = "Demographics",
    sex = case_when(
      cod_sex == 1L ~ "Male",
      cod_sex == 2L ~ "Female",
      TRUE          ~ NA_character_
    ),
    race = case_when(
      cod_race == 1L ~ "White",
      cod_race == 2L ~ "Black",
      cod_race == 3L ~ "Brown",
      cod_race == 5L ~ "Indigenous",
      TRUE           ~ NA_character_
    ),
    crowding = n_people / n_rooms
  )

# View and export
cb_render()                                              # Codebook as gt table
cb_export(file.path(tempdir(), "codebook.html"))         # Export to HTML
cb_export(file.path(tempdir(), "codebook.docx"))         # Editable Word table
cb_export(file.path(tempdir(), "codebook.xlsx"))         # Editable Excel spreadsheet
track_render()                                           # Eligibility flow as gt table

# Programmatic access
cb_get()      # Codebook as a tibble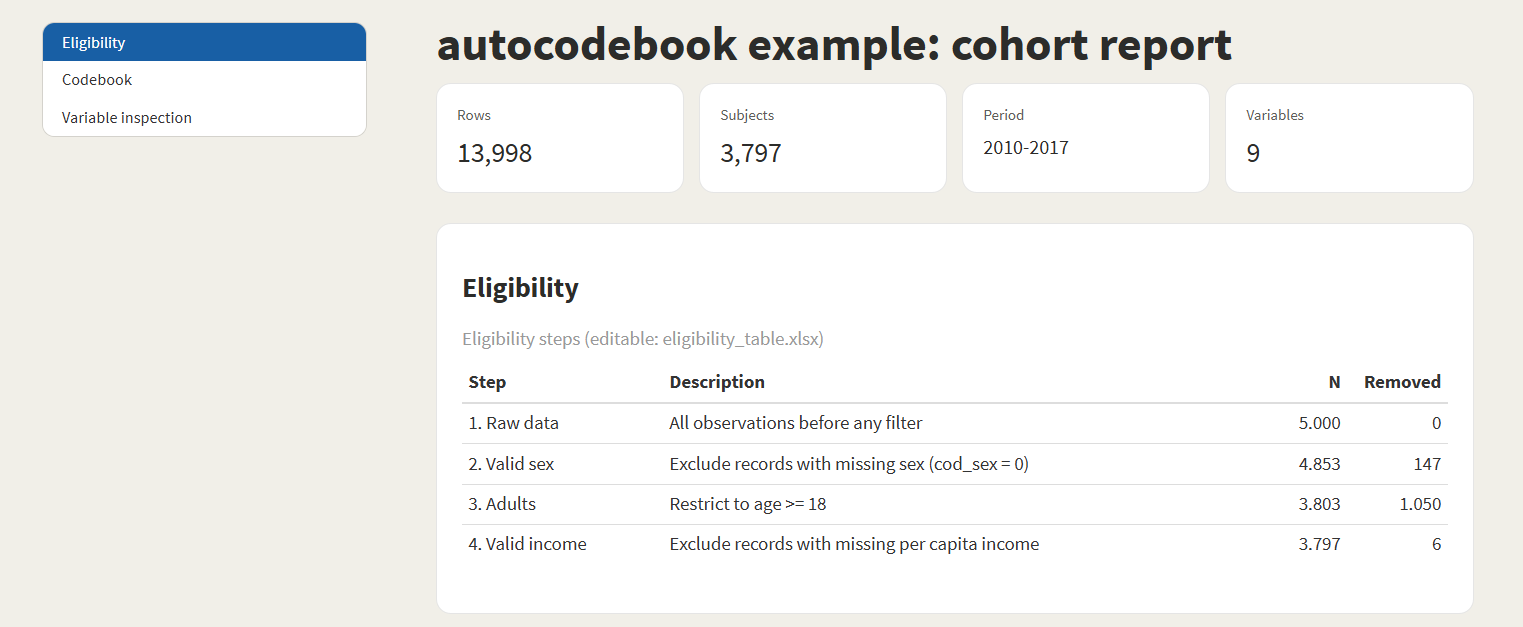
track_get() # Tracking log as a tibbleA single call to generate_report() produces a complete
dashboard with eligibility flowchart, codebook, and per-variable
inspection — ready to share with collaborators or attach as a
supplement.
generate_report(
  data        = df,
  type        = "longitudinal",         # or "cross_sectional"
  id_var      = "person_id",
  time_var    = "year",
  output_html = file.path(tempdir(), "report.html")
)
Eligibility section — automatic flowchart with N per step and number of records removed:
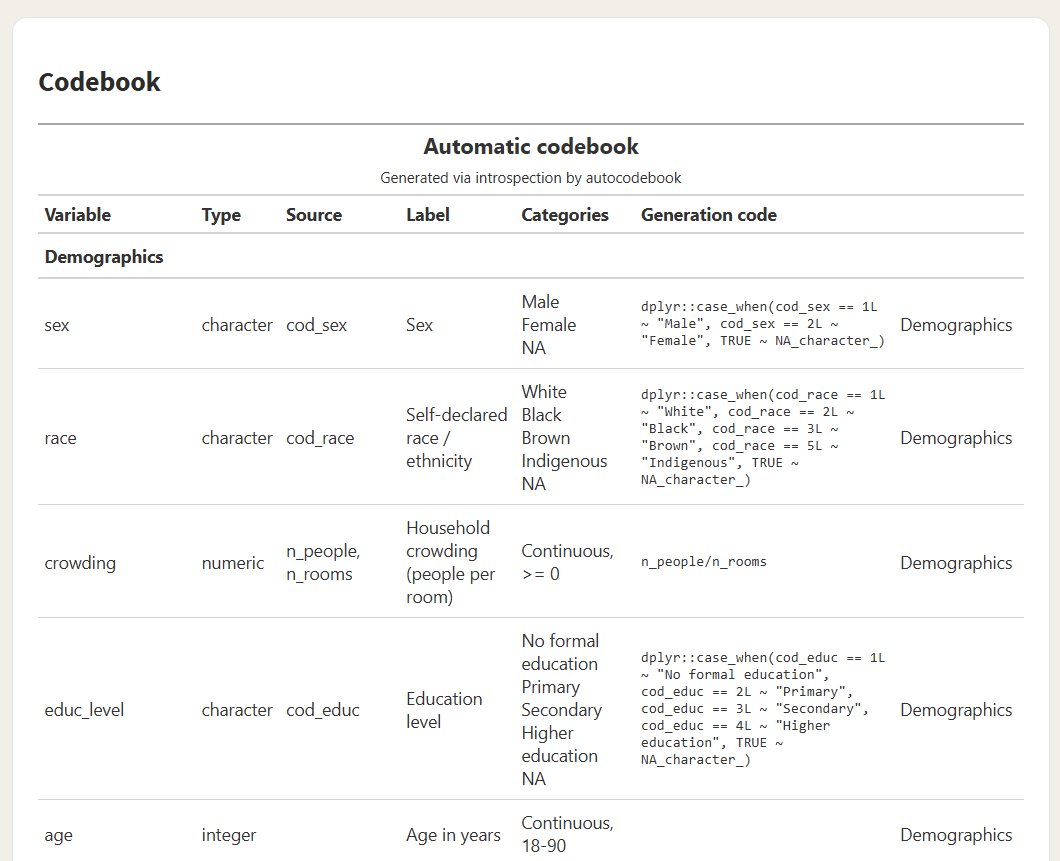
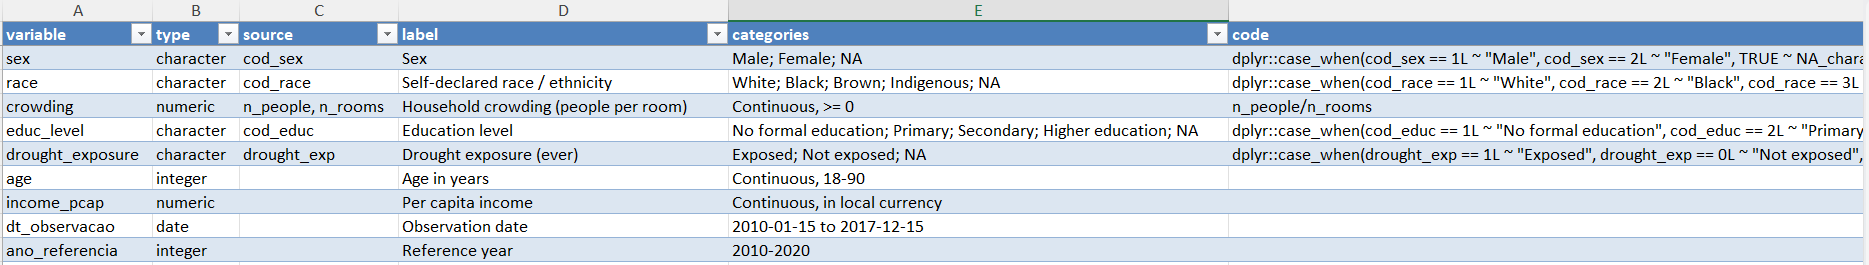
Codebook section — all derived variables with type, source, categories, and the exact code that produced them:
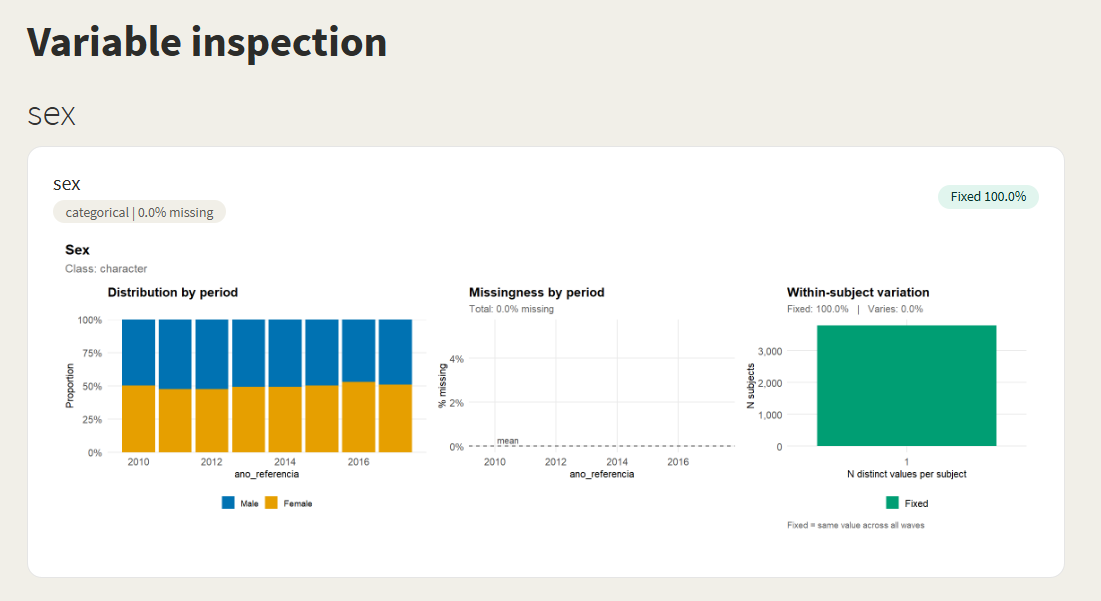
Variable inspection — distribution by period, missingness pattern, and within-subject variation (Fixed vs. Varies), per variable:
The codebook can be exported as a fully editable Word table (for paper supplements) or Excel spreadsheet (with filters, for review before publication):
Word (.docx) — paste straight into
supplementary material:
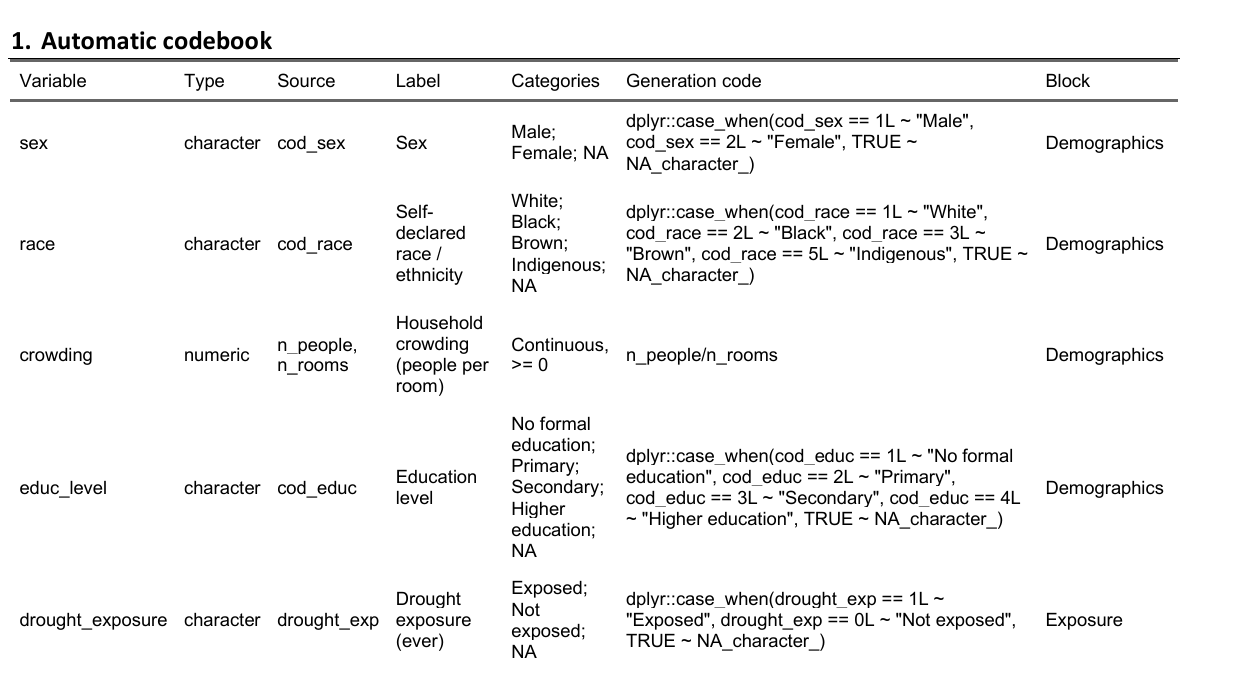
Excel (.xlsx) — filter, sort, edit,
then re-import if needed:
For studies that split the cohort by exposure (and optionally by
mediator), track_split() + track_outcomes()
capture N and outcome counts at every subgroup combination.
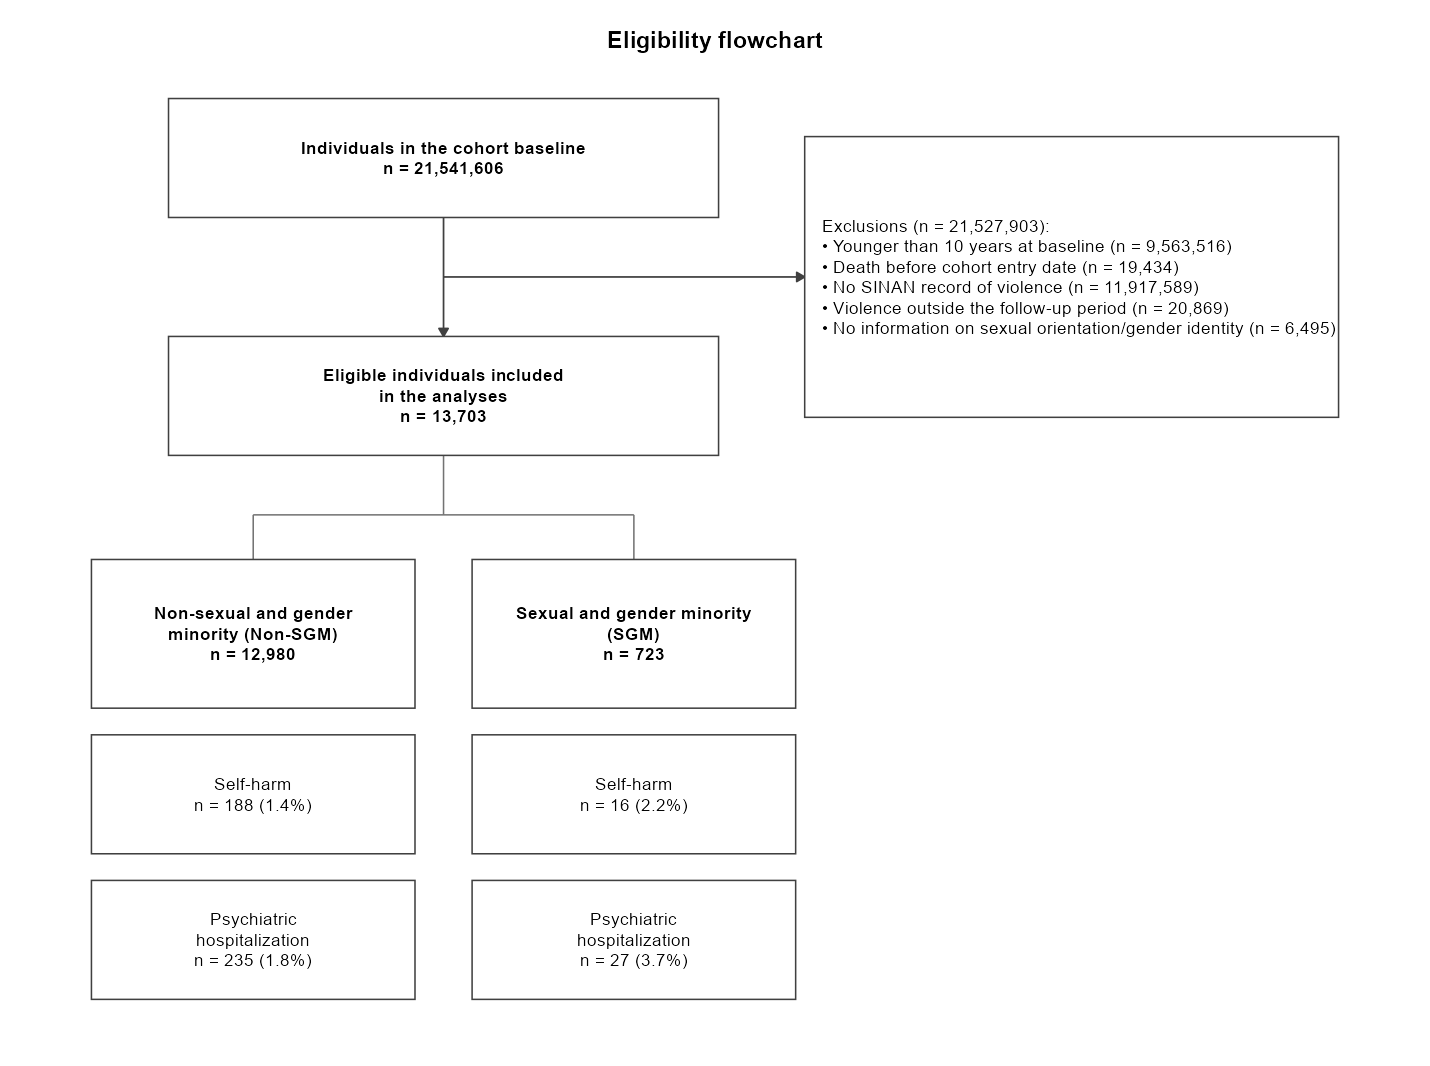
flow_diagram() then renders a publication-ready
CONSORT-style flowchart directly from the eligibility steps (recorded by
auto_filter()) and the flow tree — no manual positioning
needed:
df %>%
  auto_filter(step = "age",   description = "Younger than 10 years", age >= 10) %>%
  auto_filter(step = "sinan", description = "No record of violence", has_violence) %>%
  track_split(by = "sgm", label = "SGM status",
              value_labels = c("0" = "Non-SGM", "1" = "SGM")) %>%
  track_outcomes(c("self_harm", "psych"),
                 labels = list(self_harm = "Self-harm",
                               psych     = "Psychiatric hospitalization"))

flow_diagram()       # publication-ready ggplot
flow_table()         # the same data as a tidy tibble (one row per leaf × outcome)
flow_diagram() — vertical trunk
(baseline → aggregated exclusions → eligible cohort), one column per
subgroup, and outcome boxes stacked beneath each subgroup:
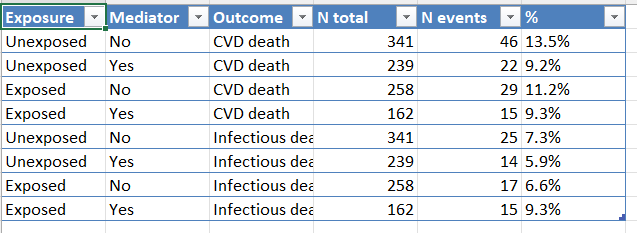
flow_table() — the same information as
a tidy tibble, ready for analysis or editable export (CSV, XLSX):
flow_diagram() returns a ggplot object, so
it can be themed, embedded in the standardized report (which does so
automatically), or saved with flow_diagram_export(). The
export format follows the file extension:
flow_diagram_export("flow.png")    # raster image
flow_diagram_export("flow.pdf")    # vector (also .svg, .eps)
flow_diagram_export("flow.emf")    # editable vector for Word (needs 'devEMF')
flow_diagram_export("flow.docx")   # Word document with the flowchart embedded (needs 'officer')
flow_diagram_export("flow.pptx")   # PowerPoint, fully editable shapes (needs 'rvg' + 'officer')
For the .pptx output, right-click the figure in
PowerPoint and choose Ungroup to edit each box and label as a
native shape. The tidy table can still be piped into a dedicated
diagramming package such as consort
or DiagrammeR
if you prefer.
Works the same way with sparklyr — no API changes:
library(sparklyr)
library(dplyr)
library(autocodebook)

sc <- spark_connect(master = "local")
df <- copy_to(sc, my_data, "my_table")

cb_init(id_col = "person_id")
track_step(df, "1. Raw data")

df <- auto_mutate(df,
  labels = list(
    region_code = "Municipality code (7 digits)",
    state_code  = "State code (first 2 digits)"
  ),
  block = "Geographic variables",
  region_code = lpad(as.character(cod_munic), 7L, "0"),
  state_code  = substring(region_code, 1L, 2L)
)

cb_render()
spark_disconnect(sc)For large Spark pipelines, several helpers reduce wasted recomputation:
cb_set_default_cache(TRUE) — caches intermediate
results across the whole session.auto_filter(..., assume_unique = TRUE) — skips the
n_distinct(id) call in tracking when the dataset is already
unique by ID (orders of magnitude faster on multi-million-row
data).cb_checkpoint(sdf, mode = "memory") — materializes a
lazy tbl_spark to break long chains of
transformations.generate_report(..., cache_data = TRUE) — persists the
dataset once before computing all report aggregations.| Function | Replaces | Registers in | Description |
|---|---|---|---|
auto_mutate() |
mutate() |
Codebook | Creates variables + auto-documents them |
auto_summarise() |
summarise() |
Codebook | Summarises + auto-documents new columns |
auto_filter() |
filter() |
Tracking | Filters + logs how many IDs remain |
| Function | Description |
|---|---|
cb_init() |
Initialize session and set the unique ID column |
cb_register() |
Manually register a variable (for edge cases) |
cb_get() |
Returns the full codebook as a tibble |
cb_reset() |
Clears all codebook entries |
cb_render() |
Renders the codebook as a formatted gt table |
cb_export() |
Saves to .html, .csv, .docx,
or .xlsx |
| Function | Description |
|---|---|
track_step() |
Records a step with unique ID count and number removed |
track_get() |
Returns the tracking log as a tibble |
track_reset() |
Clears the tracking log |
track_render() |
Renders the tracking table as a formatted gt table |
track_export() |
Saves to .html, .csv, .docx,
or .xlsx |
| Function | Description |
|---|---|
track_split() |
Adds a branching level (e.g., by exposure) |
track_outcomes() |
Stacks outcome counts on the current leaves |
flow_diagram() |
Renders a CONSORT-style flowchart (ggplot) from the
flow |
flow_diagram_export() |
Saves the flowchart (.png/.pdf/.svg/.emf/.pptx) |
flow_table() |
Tidy tibble with one row per leaf x outcome |
flow_get() |
Returns the raw flow-tree structure as a list |
flow_reset() |
Clears the flow tree |
| Function | Description |
|---|---|
generate_report() |
Builds the full HTML dashboard (+ editable exports) |
cb_checkpoint() |
Materializes a lazy tbl_spark |
cb_set_verbose() |
Toggles diagnostic messages |
cb_set_default_cache() |
Sets the session-wide default for cache |
auto_mutate(.data,
  labels = list(var1 = "Label for variable 1"),  # only required field
  block  = "Section name",                        # optional: groups in codebook
  var1   = case_when(...)                          # your normal dplyr expressions
)labels: Named list mapping variable
names to descriptions. If omitted, the variable name itself is
used.block: Optional string. Groups
variables into sections in the rendered codebook (e.g.,
"Demographics", "Migration flags").sparklyr (tbl_spark) and
local data frameslpad,
substring, lag with window_order,
etc.)stringr dependency — uses only base R
internallyrmarkdown, ggplot2,
patchwork, scales (Suggests).docx / .xlsx require
officer, flextable, openxlsx
(Suggests)MIT
These binaries (installable software) and packages are in development.
They may not be fully stable and should be used with caution. We make no claims about them.
Health stats visible at Monitor.