
The hardware and bandwidth for this mirror is donated by dogado GmbH, the Webhosting and Full Service-Cloud Provider. Check out our Wordpress Tutorial.
If you wish to report a bug, or if you are interested in having us mirror your free-software or open-source project, please feel free to contact us at mirror[@]dogado.de.
Htmlwidget for apexcharts.js : A modern JavaScript charting library to build interactive charts and visualizations with simple API. See the online documentation for examples.
![]()
![]()
Install from CRAN with:
install.packages("apexcharter")Or install the development version from GitHub with:
# install.packages("remotes")
remotes::install_github("dreamRs/apexcharter")Use apex function to quickly create visualizations :
library(apexcharter)
data("mpg", package = "ggplot2")
apex(data = mpg, type = "bar", mapping = aes(manufacturer))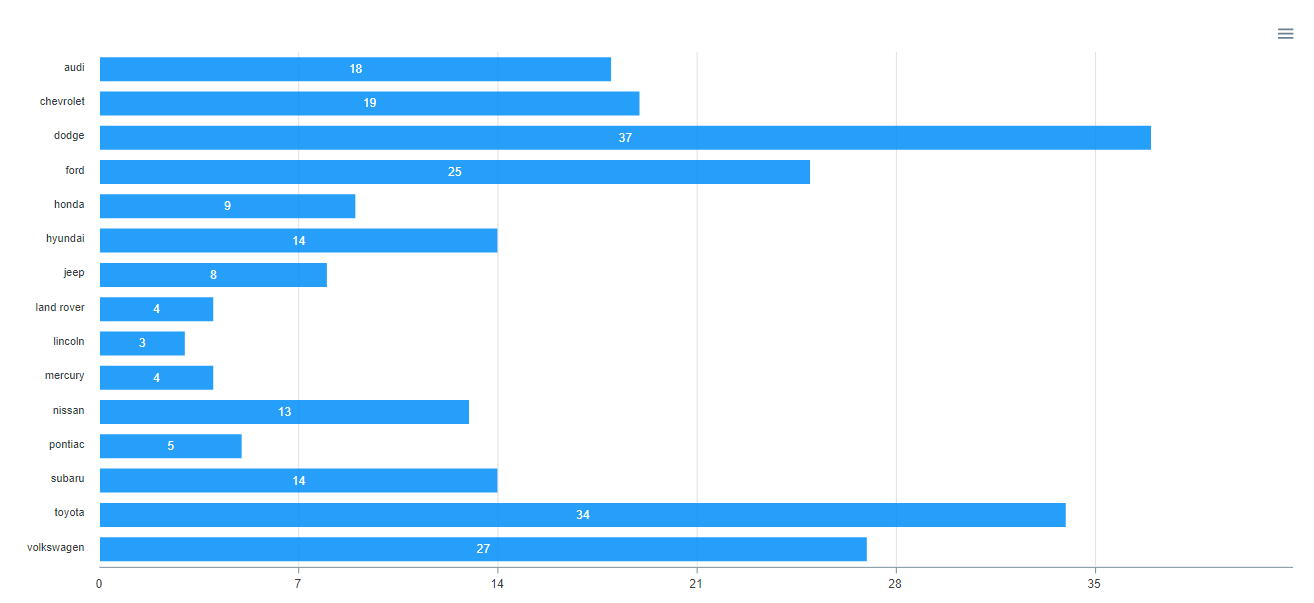
With datetime:
data("economics", package = "ggplot2")
apex(data = economics, type = "line", mapping = aes(x = date, y = uempmed)) %>%
  ax_stroke(width = 1)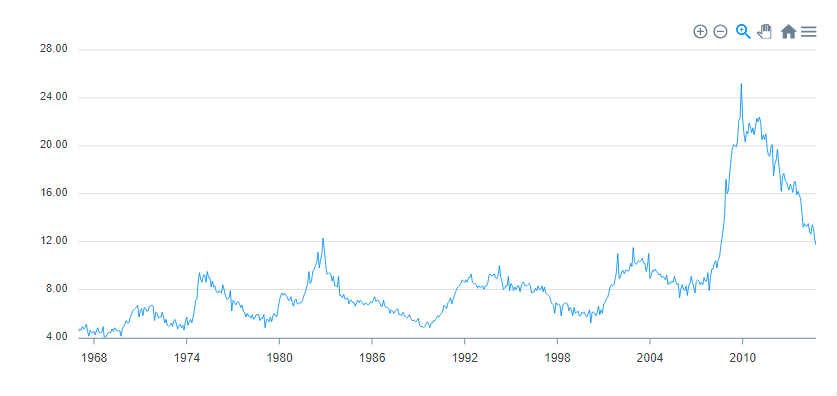
All methods from ApexCharts are available with function like
ax_* compatible with pipe from magrittr :
library(apexcharter)
data(mpg, package = "ggplot2")

apexchart() %>%
  ax_chart(type = "bar") %>%
  ax_plotOptions(bar = bar_opts(
    horizontal = FALSE,
    endingShape = "flat",
    columnWidth = "70%",
    dataLabels = list(
      position = "top"
    ))
  ) %>%
  ax_grid(
    show = TRUE,
    position = "front",
    borderColor = "#FFF"
  ) %>%
  ax_series(list(
    name = "Count",
    data = tapply(mpg$manufacturer, mpg$manufacturer, length)
  )) %>%
  ax_colors("#112446") %>%
  ax_xaxis(categories = unique(mpg$manufacturer)) %>%
  ax_title(text = "Number of models") %>%
  ax_subtitle(text = "Data from ggplot2")
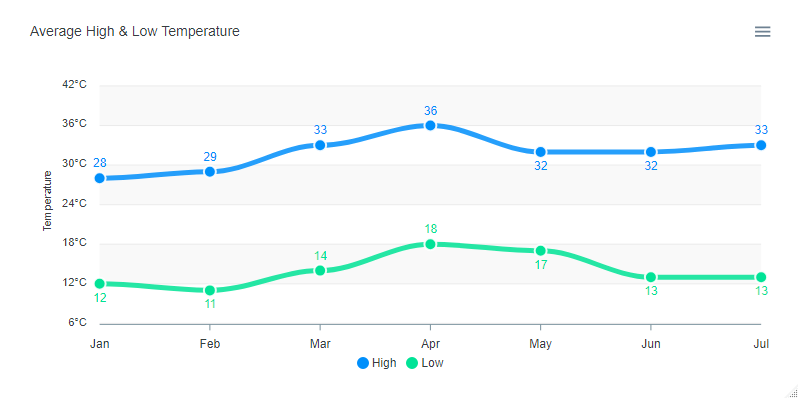
Pass a list of parameters to the function:
apexchart(ax_opts = list(
  chart = list(
    type = "line"
  ),
  stroke = list(
    curve = "smooth"
  ),
  grid = list(
    borderColor = "#e7e7e7",
    row = list(
      colors = c("#f3f3f3", "transparent"),
      opacity = 0.5
    )
  ),
  dataLabels = list(
    enabled = TRUE
  ),
  markers = list(style = "inverted", size = 6),
  series = list(
    list(
      name = "High",
      data = c(28, 29, 33, 36, 32, 32, 33)
    ),
    list(
      name = "Low",
      data = c(12, 11, 14, 18, 17, 13, 13)
    )
  ),
  title = list(
    text = "Average High & Low Temperature",
    align = "left"
  ),
  xaxis = list(
    categories = month.abb[1:7]
  ),
  yaxis = list(
    title = list(text = "Temperature"),
    labels = list(
      formatter = htmlwidgets::JS("function(value) {return value + '\u00b0C';}")
    )
  )
))
This package use {packer} to manage JavaScript assets, see packer’s documentation for more.
Install nodes modules with:
packer::npm_install()Modify srcjs/widgets/apexcharter.js, then run:
packer::bundle()Re-install R package and try apexcharter() or
apex() functions.
These binaries (installable software) and packages are in development.
They may not be fully stable and should be used with caution. We make no claims about them.
Health stats visible at Monitor.