
The hardware and bandwidth for this mirror is donated by dogado GmbH, the Webhosting and Full Service-Cloud Provider. Check out our Wordpress Tutorial.
If you wish to report a bug, or if you are interested in having us mirror your free-software or open-source project, please feel free to contact us at mirror[@]dogado.de.
![]()


![]()
Simple radiocarbon calibration and chronological analysis. This package allows the calibration of radiocarbon ages and modern carbon fraction (F14C) values using multiple calibration curves. It allows the calculation of highest density region intervals and credible intervals. The package also provides tools for visualising results and estimating statistical summaries.
This package is currently experimental. This means that it is functional, but interfaces and functionalities may change over time, testing and documentation may be lacking.
To cite ananke in publications use:
Frerebeau N (2026). ananke: Quantitative Chronology in Archaeology. Université Bordeaux Montaigne, Pessac, France. doi:10.5281/zenodo.13236285 https://doi.org/10.5281/zenodo.13236285. R package version 0.3.0, https://packages.tesselle.org/ananke/.
This package is a part of the tesselle project https://www.tesselle.org.
You can install the released version of ananke from CRAN with:
install.packages("ananke")And the development version from Codeberg with:
# install.packages("remotes")
remotes::install_git("https://codeberg.org/tesselle/ananke")# Install extra package, if needed
# install.packages("khroma")
## Load packages
library(ananke)
#> Loading required package: aion
library(khroma)ananke uses aion for
internal date representation. Look at
vignette("aion", package = "aion") before you start.
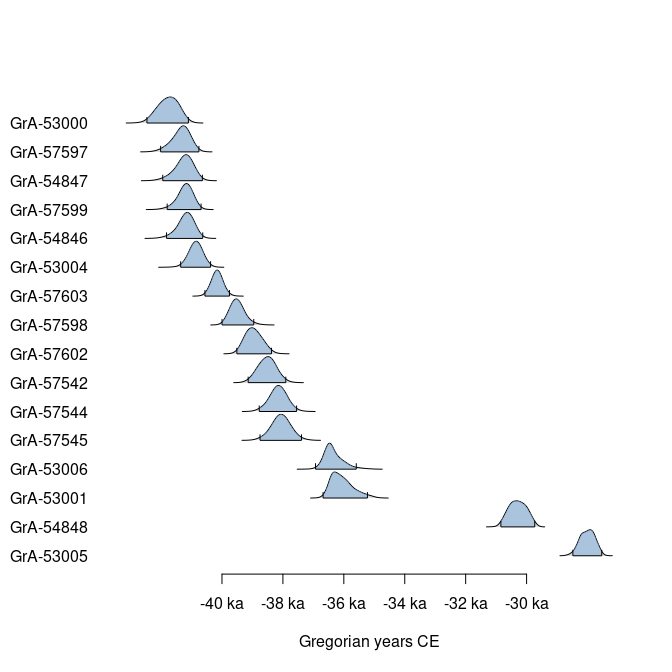
## Data from Bosch et al. 2015
data("ksarakil")

## Graphical parameters
par(mar = c(4, 6, 1, 1) + 0.1) # Adjust margins

## Calibrate multiple ages
cal <- c14_calibrate(
  values = ksarakil$date,
  errors = ksarakil$error,
  names = ksarakil$code,
  curves = "marine13",
  reservoir_offsets = 53,
  reservoir_errors = 43,
  from = 50000, to = 0
)

## Plot calibrated ages
ridgelines(
  x = cal,
  calendar = CE(),
  col = palette_color_picker("bright")(ksarakil$phase)
)
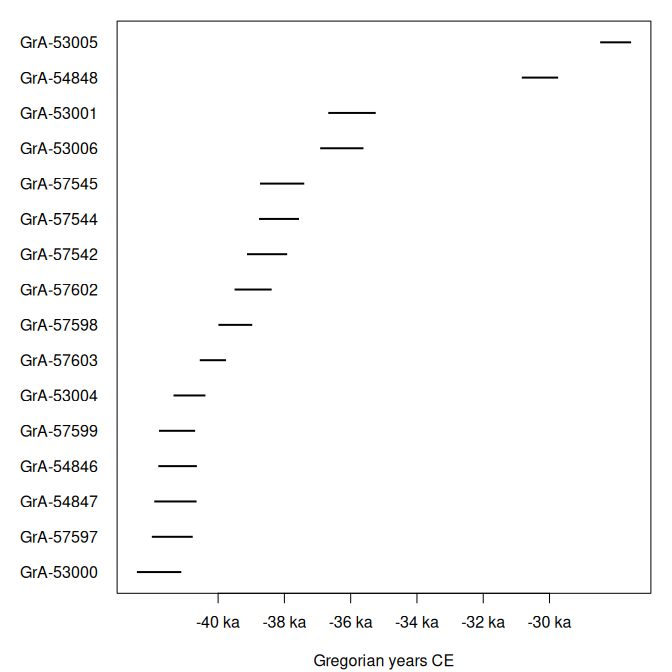
## 95% intervals
hdr95 <- interval_hdr(cal, level = 0.95)
as.data.frame(hdr95, calendar = CE())
#>        label  start    end    p
#> 1  GrA-53005 -28472 -27538 0.95
#> 2  GrA-54848 -30837 -29740 0.95
#> 3  GrA-53006 -36920 -35614 0.95
#> 4  GrA-57545 -38737 -37401 0.95
#> 5  GrA-54847 -41927 -40650 0.95
#> 6  GrA-57544 -38765 -37560 0.95
#> 7  GrA-57598 -39991 -38970 0.95
#> 8  GrA-57599 -41784 -40694 0.95
#> 9  GrA-53001 -36676 -35245 0.95
#> 10 GrA-54846 -41804 -40640 0.95
#> 11 GrA-57602 -39504 -38384 0.95
#> 12 GrA-57603 -40553 -39761 0.95
#> 13 GrA-57542 -39129 -37916 0.95
#> 14 GrA-53004 -41346 -40383 0.95
#> 15 GrA-57597 -42000 -40766 0.95
#> 16 GrA-53000 -42451 -41111 0.95

## Plot intervals
plot(
  x = hdr95,
  calendar = CE(),
  col = palette_color_picker("bright")(ksarakil$phase),
  lwd = 2
)
This package provides translations of user-facing communications,
like messages, warnings and errors, and graphical elements (axis
labels). The preferred language is by default taken from the locale.
This can be overridden by setting of the environment variable
LANGUAGE (you only need to do this once per session):
Sys.setenv(LANGUAGE = "<language code>")Languages currently available are English (en) and
French (fr).
Please note that the ananke project is released with a Contributor Code of Conduct. By contributing to this project, you agree to abide by its terms.
These binaries (installable software) and packages are in development.
They may not be fully stable and should be used with caution. We make no claims about them.
Health stats visible at Monitor.