
The hardware and bandwidth for this mirror is donated by dogado GmbH, the Webhosting and Full Service-Cloud Provider. Check out our Wordpress Tutorial.
If you wish to report a bug, or if you are interested in having us mirror your free-software or open-source project, please feel free to contact us at mirror[@]dogado.de.
![]()
R package for the ACute COPD Exacerbation Prediction Tool (ACCEPT)
ACCEPT is a prediction model for predicting probability, rate, and severity of exacerbations (also known as lung attacks) in patients with Chronic Obstructive Pulmonary Disease.
ACCEPT has been developed by researchers at the University of British Columbia. Please refer to the published papers for more information:
Adibi A, Sin DD, Safari A, Jonhson KM, Aaron SD, FitzGerald JM, Sadatsafavi M. The Acute COPD Exacerbation Prediction Tool (ACCEPT): a modelling study. The Lancet Respiratory Medicine, Volume 8, Issue 10, 1013 - 1021; doi:10.1016/S2213-2600(19)30397-2
Safari, A., Adibi, A., Sin, D.D., Lee, T.Y., Ho, J.K., Sadatsafavi, M. and IMPACT study team, 2022. ACCEPT 2· 0: Recalibrating and externally validating the Acute COPD exacerbation prediction tool (ACCEPT). EClinicalMedicine, 51, p.101574. doi:10.1016/j.eclinm.2022.101574
The following animation explains the accept model in 90
seconds:

The latest stable version can be downloaded from CRAN:
install.packages('accept')
You can install the development version of accept from GitHub with:
# install.packages("pak")
pak::pak("resplab/accept")The function accept() provides predictions from the
latest version of the accept prediction model.
accept1() provides predictions of exacerbations for COPD
patients per original published manuscript. accept2() is an
updated version of ACCEPT that is fine tuned for improved predictions in
patients who do not have a prior history of exacerbations.
To get a prediction for exacerbation rate, you will need to pass in a
patient vector. The accept package comes with a sample patient data
tibble called samplePatients:
library(accept)
accept(samplePatients) #accept uses the latest updated prediction model
#>      ID  male age smoker oxygen statin LAMA LABA   ICS FEV1 BMI SGRQ
#> 1 10001  TRUE  70   TRUE   TRUE   TRUE TRUE TRUE  TRUE   33  25   50
#> 2 10002 FALSE  42  FALSE   TRUE  FALSE TRUE TRUE FALSE   40  35   40
#>   LastYrExacCount LastYrSevExacCount predicted_exac_probability
#> 1               2                  1                  0.8327888
#> 2               0                  0                  0.4366622
#>   predicted_exac_probability_lower_PI predicted_exac_probability_upper_PI
#> 1                           0.1929329                           0.9924159
#> 2                           0.0000000                           0.8998712
#>   predicted_exac_rate predicted_exac_rate_lower_PI predicted_exac_rate_upper_PI
#> 1           1.7884977                    0.2143485                     4.881703
#> 2           0.5738758                    0.0000000                     2.301298
#>   predicted_severe_exac_probability predicted_severe_exac_probability_lower_PI
#> 1                         0.6026383                                 0.09371195
#> 2                         0.1085515                                 0.02547523
#>   predicted_severe_exac_probability_upper_PI predicted_severe_exac_rate
#> 1                                  0.9575906                  0.9229084
#> 2                                  0.4784134                  0.1149076
#>   predicted_severe_exac_rate_lower_PI predicted_severe_exac_rate_upper_PI
#> 1                          0.09839809                            3.160385
#> 2                          0.02580535                            0.650880
#>   azithromycin_predicted_exac_probability
#> 1                               0.7633086
#> 2                               0.3291975
#>   azithromycin_predicted_exac_probability_lower_PI
#> 1                                        0.1286904
#> 2                                        0.0000000
#>   azithromycin_predicted_exac_probability_upper_PI
#> 1                                        0.9793698
#> 2                                        0.8524301
#>   azithromycin_predicted_exac_rate azithromycin_predicted_exac_rate_lower_PI
#> 1                        1.4409981                                 0.1377579
#> 2                        0.3992806                                 0.0000000
#>   azithromycin_predicted_exac_rate_upper_PI
#> 1                                  3.880998
#> 2                                  1.913453
#>   azithromycin_predicted_severe_exac_probability
#> 1                                     0.51103045
#> 2                                     0.08544925
#>   azithromycin_predicted_severe_exac_probability_lower_PI
#> 1                                              0.07570494
#> 2                                              0.02469734
#>   azithromycin_predicted_severe_exac_probability_upper_PI
#> 1                                               0.9221162
#> 2                                               0.3567065
#>   azithromycin_predicted_severe_exac_rate
#> 1                              0.71545506
#> 2                              0.08932232
#>   azithromycin_predicted_severe_exac_rate_lower_PI
#> 1                                       0.07872393
#> 2                                       0.02500744
#>   azithromycin_predicted_severe_exac_rate_upper_PI
#> 1                                        2.5525368
#> 2                                        0.4411541
accept2() and accept1() functions return a more detailed dataframe with the predictions for different treatment options with measures of uncertainty.
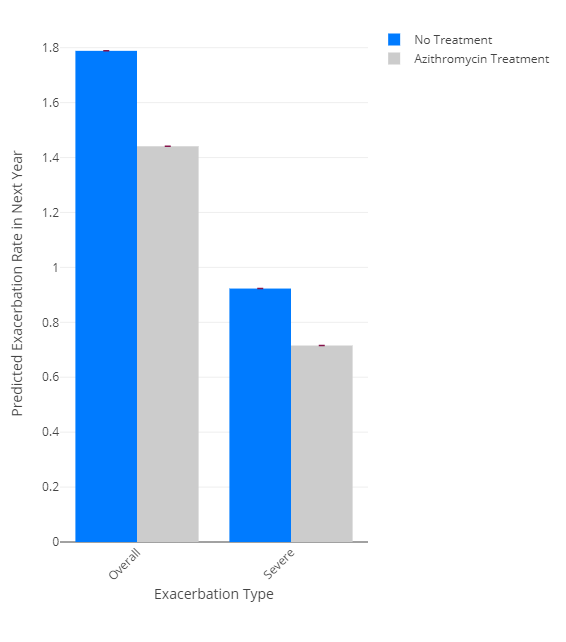
To visualize the data, there is a graphing function called plotExacerbations(), which creates a Plotly bar graph. You have the option of selecting probability or rate for which prediction you want to see, and either CI or PI to select the confidence interval or prediction interval respectively.
results <- accept2(samplePatients[1,])

plotExacerbations(results, type="probability")

plotExacerbations(results, type="rate")
You can also calculate the predicted number of exacerbations in a year:
results <- accept2(samplePatients[1,])
exacerbationsMatrix <- predictCountProb(results, n = 10, shortened = TRUE)
print(exacerbationsMatrix)
#>                         none severe   1 severe   2 severe 3 or more severe
#> no exacerbations         0.16721119 0.00000000 0.00000000       0.00000000
#> 1 exacerbation           0.11883372 0.18022310 0.00000000       0.00000000
#> 2 exacerbations          0.04222640 0.12808103 0.09712378       0.00000000
#> 3 or more exacerbations  0.01206628 0.05851757 0.10055944       0.07102149
The shortened parameter groups the probabilities from 3-10 exacerbations into one category, “3 or more exacerbations.” To see all n exacerbation probabilities:
exacerbationsMatrix <- predictCountProb(results, n = 10, shortened = FALSE)
print(exacerbationsMatrix)
#>                       0 severe     1 severe     2 severe     3 severe
#> 0 exacerbation(s) 1.672112e-01 0.000000e+00 0.000000e+00 0.000000e+00
#> 1 exacerbation(s) 1.188337e-01 1.802231e-01 0.000000e+00 0.000000e+00
#> 2 exacerbation(s) 4.222640e-02 1.280810e-01 9.712378e-02 0.000000e+00
#> 3 exacerbation(s) 1.000316e-02 4.551234e-02 6.902397e-02 3.489389e-02
#> 4 exacerbation(s) 1.777262e-03 1.078158e-02 2.452699e-02 2.479841e-02
#> 5 exacerbation(s) 2.526131e-04 1.915564e-03 5.810285e-03 8.811872e-03
#> 6 exacerbation(s) 2.992120e-05 2.722708e-04 1.032314e-03 2.087475e-03
#> 7 exacerbation(s) 3.037773e-06 3.224959e-05 1.467291e-04 3.708819e-04
#> 8 exacerbation(s) 2.698608e-07 3.274164e-06 1.737958e-05 5.271571e-05
#> 9 exacerbation(s) 2.130942e-08 2.908606e-07 1.764475e-06 6.244004e-06
#>                       4 severe     5 severe     6 severe     7 severe
#> 0 exacerbation(s) 0.000000e+00 0.000000e+00 0.000000e+00 0.000000e+00
#> 1 exacerbation(s) 0.000000e+00 0.000000e+00 0.000000e+00 0.000000e+00
#> 2 exacerbation(s) 0.000000e+00 0.000000e+00 0.000000e+00 0.000000e+00
#> 3 exacerbation(s) 0.000000e+00 0.000000e+00 0.000000e+00 0.000000e+00
#> 4 exacerbation(s) 9.402310e-03 0.000000e+00 0.000000e+00 0.000000e+00
#> 5 exacerbation(s) 6.682038e-03 2.026794e-03 0.000000e+00 0.000000e+00
#> 6 exacerbation(s) 2.374397e-03 1.440403e-03 3.640856e-04 0.000000e+00
#> 7 exacerbation(s) 5.624791e-04 5.118332e-04 2.587485e-04 5.605968e-05
#> 8 exacerbation(s) 9.993573e-05 1.212499e-04 9.194377e-05 3.984052e-05
#> 9 exacerbation(s) 1.420447e-05 2.154249e-05 2.178088e-05 1.415694e-05
#>                       8 severe     9 severe
#> 0 exacerbation(s) 0.000000e+00 0.000000e+00
#> 1 exacerbation(s) 0.000000e+00 0.000000e+00
#> 2 exacerbation(s) 0.000000e+00 0.000000e+00
#> 3 exacerbation(s) 0.000000e+00 0.000000e+00
#> 4 exacerbation(s) 0.000000e+00 0.000000e+00
#> 5 exacerbation(s) 0.000000e+00 0.000000e+00
#> 6 exacerbation(s) 0.000000e+00 0.000000e+00
#> 7 exacerbation(s) 0.000000e+00 0.000000e+00
#> 8 exacerbation(s) 7.552761e-06 0.000000e+00
#> 9 exacerbation(s) 5.367600e-06 9.044996e-07
To visualize the matrix as a heatmap, we can use the function plotHeatMap:
plotHeatMap(results, shortened = FALSE)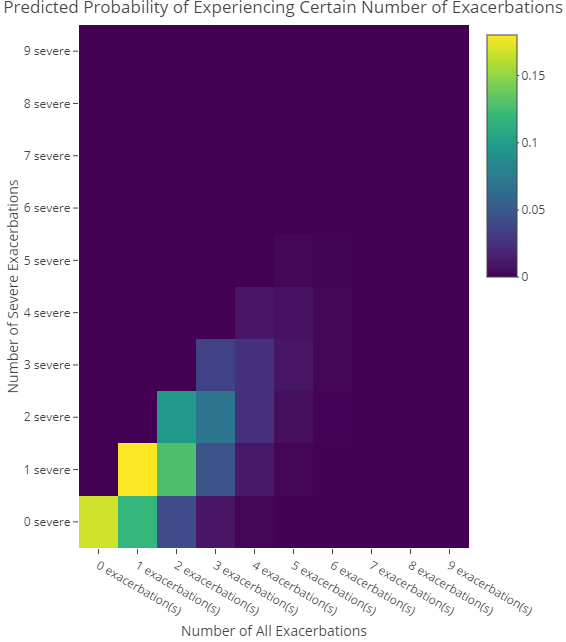
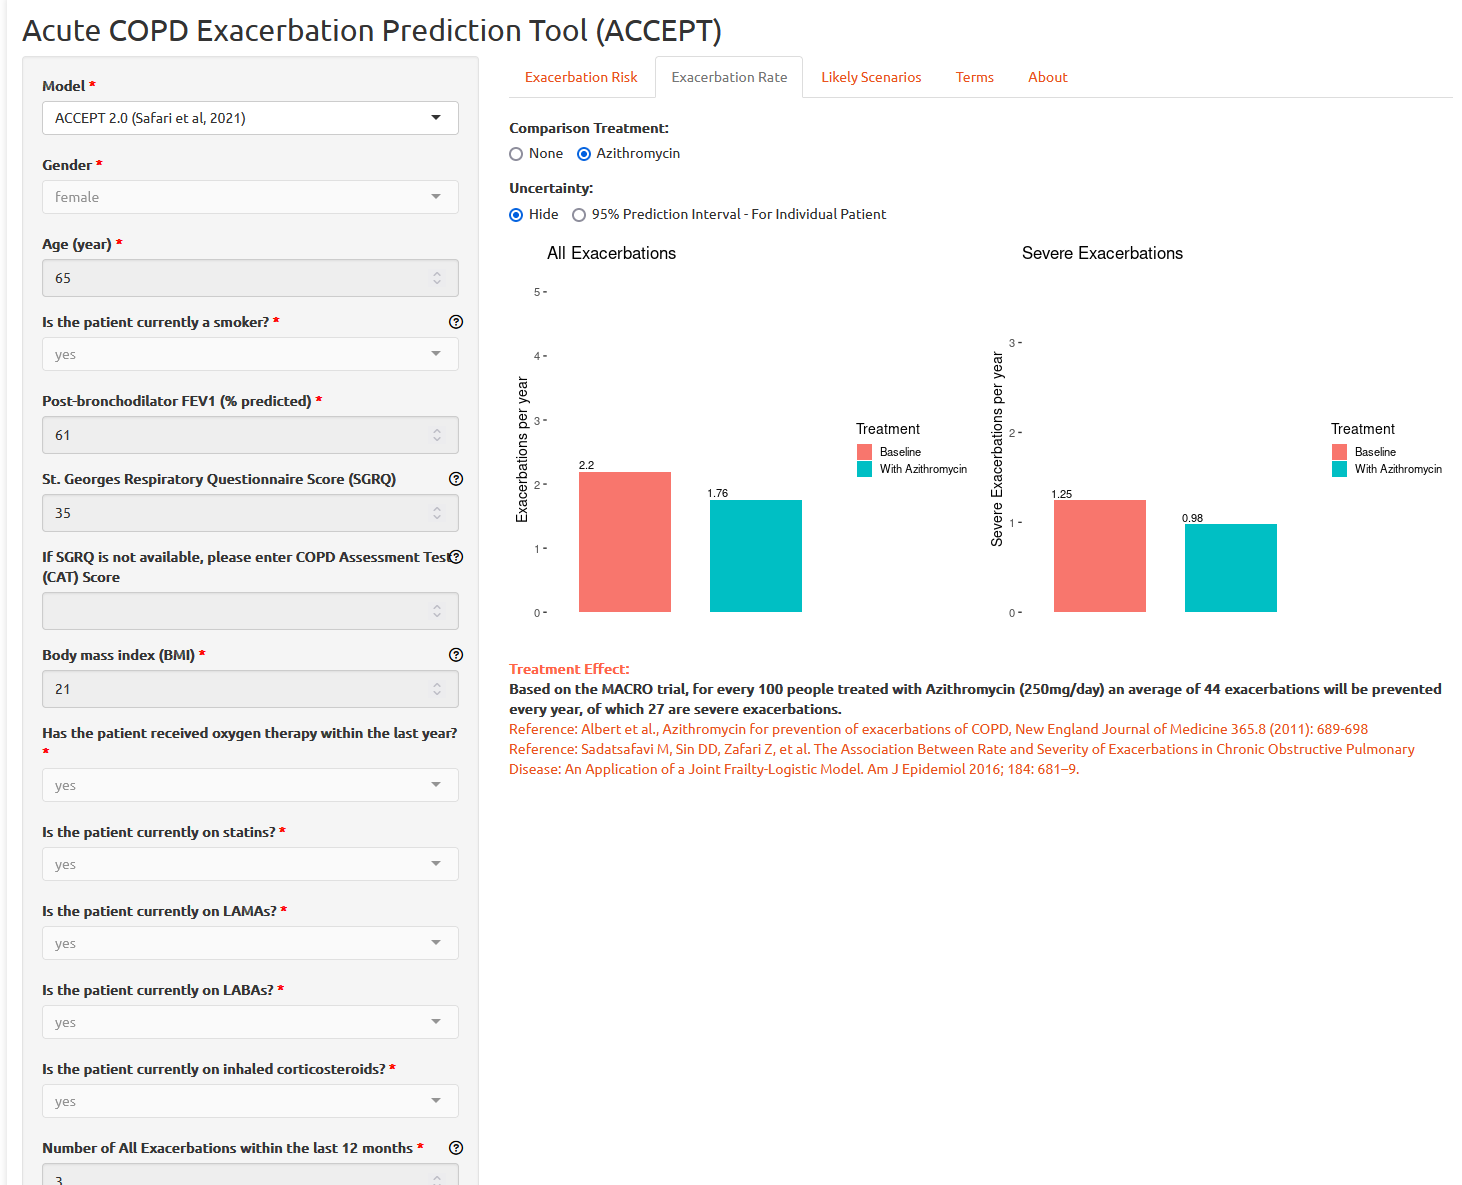
ACCEPT is also available as web app, accessible at http://resp.core.ubc.ca/ipress/accept
You can use vetiver and plumber packages to create, deploy, and monitor an API for ACCEPT:
library(vetiver)
v_accept <- vetiver_model(accept,
                   "accept-model")
To test to API locally, you can use
library(plumber)
pr() |>
    vetiver_api(v_accept) |>
pr_run()The Peer Models Network allows users to access ACCEPT through the cloud. A MACRO-enabled Excel-file can be used to interact with the model and see the results. To download the PRISM Excel template file for ACCEPT, please refer to the Peer Models Network model repository.
import json
import requests
url = 'https://prism.peermodelsnetwork.com/route/accept/run'
headers = {'x-prism-auth-user': YOUR_API_KEY}
model_run = requests.post(url, headers=headers,
json = {"func":["prism_model_run"],"model_input":[{"ID": "10001","male": 1,"age": 57,"smoker": 0,"oxygen": 0,"statin": 0,"LAMA": 1,"LABA": 1,"ICS": 1,"FEV1": 51,"BMI": 18,"SGRQ": 63,"LastYrExacCount": 2,"LastYrSevExacCount": 1,"randomized_azithromycin": 0,"randomized_statin": 0,"randomized_LAMA": 0,"randomized_LABA": 0,"randomized_ICS": 0, "random_sampling_N" : 100,  "calculate_CIs" : "TRUE"}]})
print(model_run)
results = json.loads(model_run.text)
print(results)In Ubuntu, you can call the API with curl:
curl \
-X POST \
-H "x-prism-auth-user: REPLACE_WITH_API_KEY" \
-H "Content-Type: application/json" \
-d '{"func":["prism_model_run"],"model_input":[{"ID": "10001","male": 1,"age": 57,"smoker": 0,"oxygen": 0,"statin": 0,"LAMA": 1,"LABA": 1,"ICS": 1,"FEV1": 51,"BMI": 18,"SGRQ": 63,"LastYrExacCount": 2,"LastYrSevExacCount": 1,"randomized_azithromycin": 0,"randomized_statin": 0,"randomized_LAMA": 0,"randomized_LABA": 0,"randomized_ICS": 0, "random_sampling_N" : 100,
"calculate_CIs" : "TRUE"}]}' \
https://prism.peermodelsnetwork.com/route/accept/runPlease cite:
Adibi A, Sin DD, Safari A, Jonhson KM, Aaron SD, FitzGerald JM, Sadatsafavi M. The Acute COPD Exacerbation Prediction Tool (ACCEPT): a modelling study. The Lancet Respiratory Medicine. Volume 8, Issue 10, 1013 - 1021 doi:10.1016/S2213-2600(19)30397-2
Safari, A., Adibi, A., Sin, D.D., Lee, T.Y., Ho, J.K., Sadatsafavi, M. and IMPACT study team, 2022. ACCEPT 2· 0: Recalibrating and externally validating the Acute COPD exacerbation prediction tool (ACCEPT). EClinicalMedicine, 51, p.101574. doi:10.1016/j.eclinm.2022.101574
These binaries (installable software) and packages are in development.
They may not be fully stable and should be used with caution. We make no claims about them.
Health stats visible at Monitor.