The hardware and bandwidth for this mirror is donated by dogado GmbH, the Webhosting and Full Service-Cloud Provider. Check out our Wordpress Tutorial.
If you wish to report a bug, or if you are interested in having us mirror your free-software or open-source project, please feel free to contact us at mirror[@]dogado.de.
Generate Venn diagrams from two or three sets, displaying the overlapping items as lists in the appropriate sections. The lists can be split into columns or shortened for large sets and the plot is generated using ‘ggplot2’ allowing further customisations.
You can install the development version of VennItem from GitHub with:
# install.packages("pak")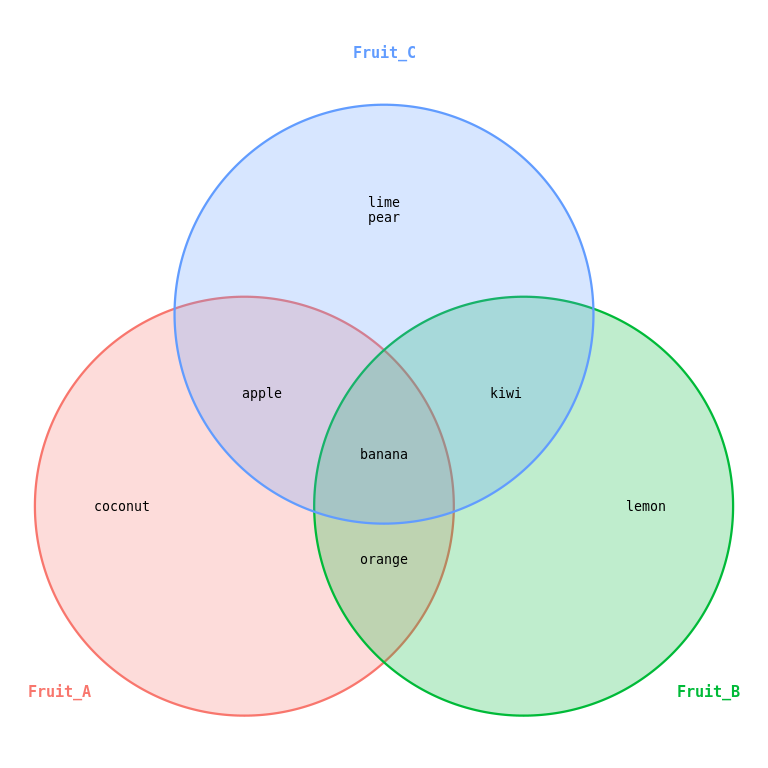
pak::pak("microbialman/VennItem")Basic example showing two small sets.
library(VennItem)
sets <- list(Fruit_A = c("apple","banana","coconut","orange"), Fruit_B = c("banana","kiwi","lemon","orange"), Fruit_C = c("banana","kiwi","apple","pear","lime"))
vennItem(sets, set_label_size = 4)
Example of larger sets showing column formatting ability.
big_sets <- list(Fruit_A = c("apple","banana","durian","lychee","grapes","pear","melon"),
 Fruit_B = c("banana","kiwi","satsuma","orange","lemon","lime"),
 Fruit_C = c("banana","kiwi","apple","pear","coconut"))

vennItem(big_sets, ncol_items = 2)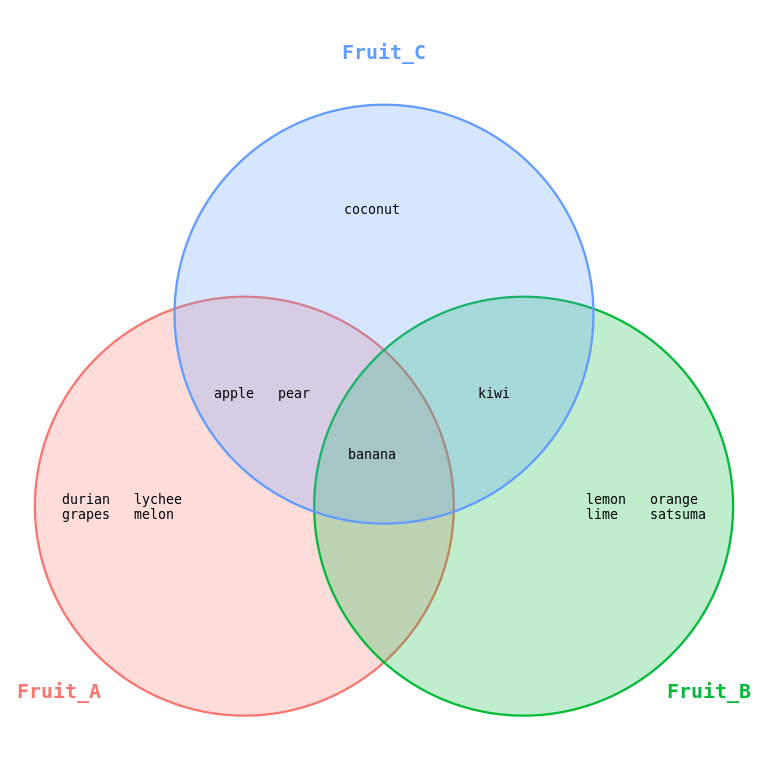
Example of larger sets showing shortening.
big_sets <- list(Fruit_A = c("apple","banana","durian","lychee","grapes","pear","melon"),
 Fruit_B = c("banana","kiwi","satsuma","orange","lemon","lime"),
 Fruit_C = c("banana","kiwi","apple","pear","coconut"))

vennItem(big_sets, max_items_per_region = 2)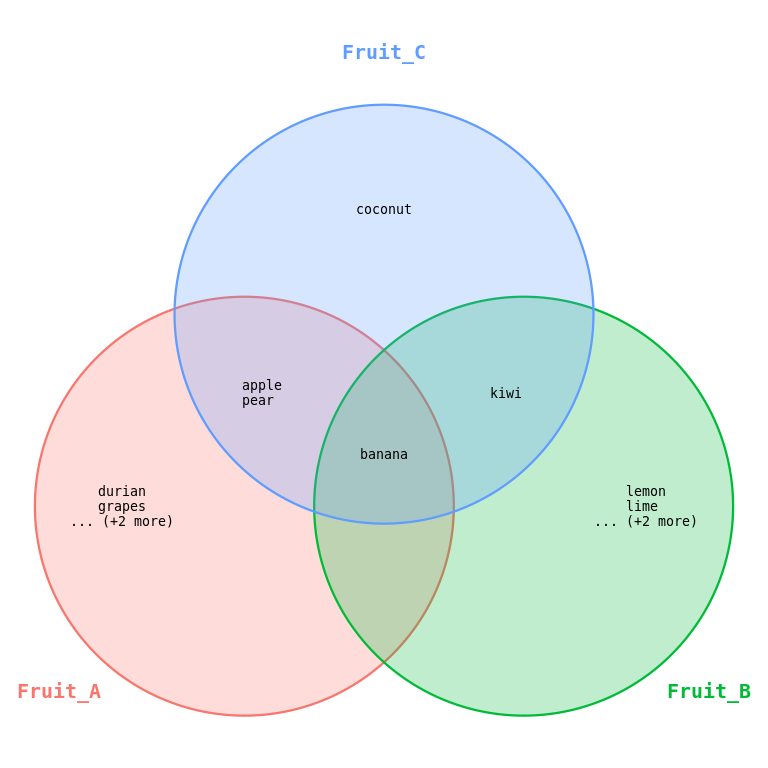
Example showing basic numbering of set size.
sets <- list(Fruit_A = c("apple","banana","coconut","orange"), Fruit_B = c("banana","kiwi","lemon","orange"), Fruit_C = c("banana","kiwi","apple","pear","lime"))
vennItem(sets, max_items_per_region = 0)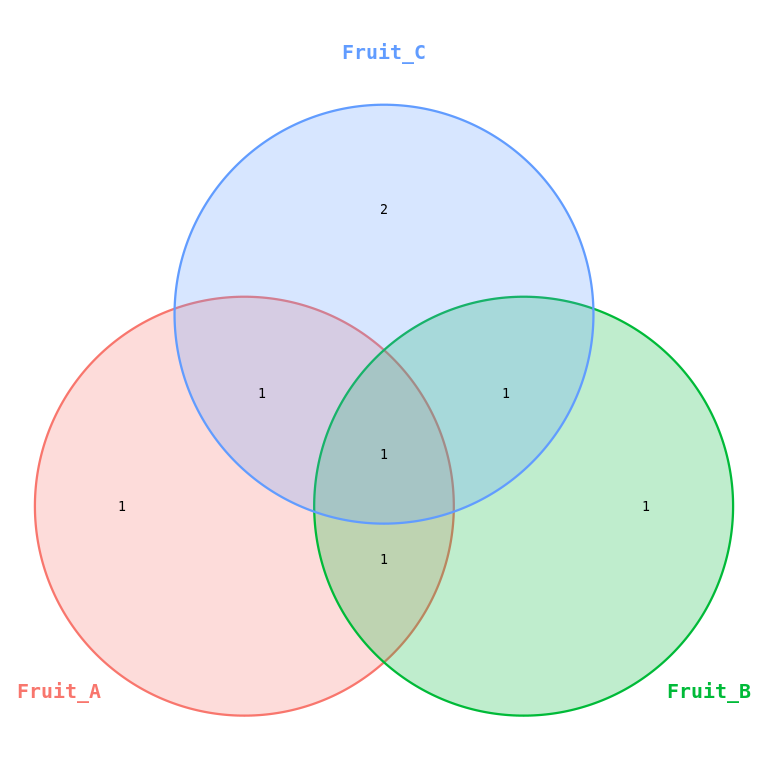
These binaries (installable software) and packages are in development.
They may not be fully stable and should be used with caution. We make no claims about them.
Health stats visible at Monitor.