The hardware and bandwidth for this mirror is donated by dogado GmbH, the Webhosting and Full Service-Cloud Provider. Check out our Wordpress Tutorial.
If you wish to report a bug, or if you are interested in having us mirror your free-software or open-source project, please feel free to contact us at mirror[@]dogado.de.
![]()
![]()
The goal of {TidyDensity} is to make working with random
numbers from different distributions easy. All tidy_
distribution functions provide the following components:
r_]d_]q_]p_]You can install the released version of {TidyDensity}
from CRAN with:
install.packages("TidyDensity")And the development version from GitHub with:
# install.packages("devtools")
devtools::install_github("spsanderson/TidyDensity")This is a basic example which shows you how to solve a common problem:
library(TidyDensity)
library(dplyr)
library(ggplot2)

tidy_normal()
#> # A tibble: 50 × 7
#>    sim_number     x       y    dx       dy      p       q
#>    <fct>      <int>   <dbl> <dbl>    <dbl>  <dbl>   <dbl>
#>  1 1              1 -1.87   -3.51 0.000235 0.0307 -1.87
#>  2 1              2 -0.839  -3.37 0.000617 0.201  -0.839
#>  3 1              3  0.580  -3.22 0.00147  0.719   0.580
#>  4 1              4 -0.0620 -3.07 0.00322  0.475  -0.0620
#>  5 1              5  0.360  -2.92 0.00644  0.641   0.360
#>  6 1              6 -0.165  -2.78 0.0118   0.434  -0.165
#>  7 1              7 -1.65   -2.63 0.0201   0.0494 -1.65
#>  8 1              8 -0.277  -2.48 0.0315   0.391  -0.277
#>  9 1              9  1.77   -2.34 0.0461   0.961   1.77
#> 10 1             10  0.604  -2.19 0.0628   0.727   0.604
#> # ℹ 40 more rows
An example plot of the tidy_normal data.
tn <- tidy_normal(.n = 100, .num_sims = 6)

tidy_autoplot(tn, .plot_type = "density")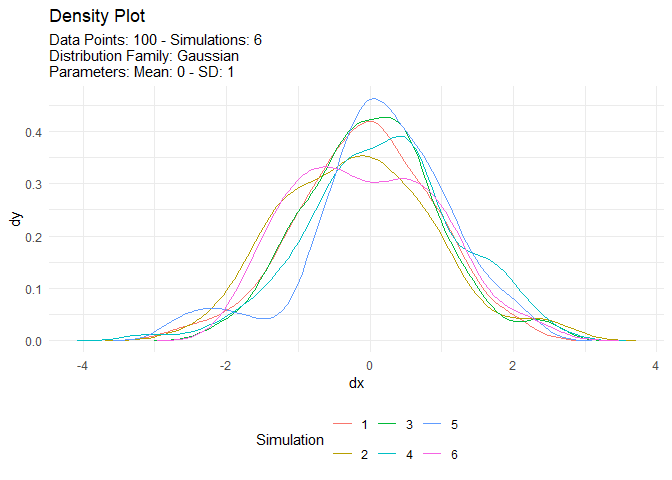
tidy_autoplot(tn, .plot_type = "quantile")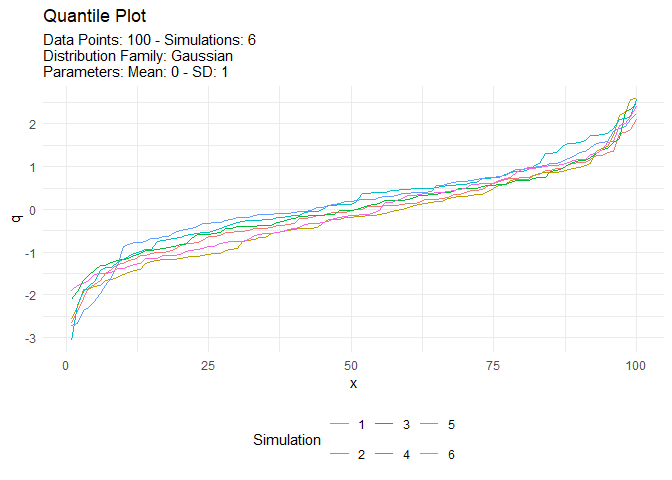
tidy_autoplot(tn, .plot_type = "probability")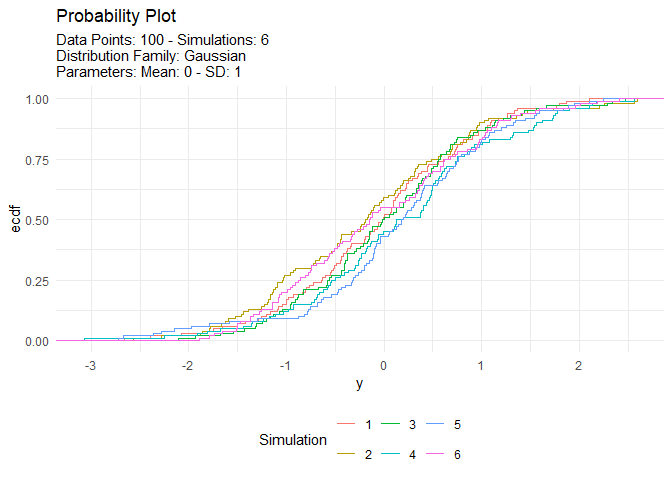
tidy_autoplot(tn, .plot_type = "qq")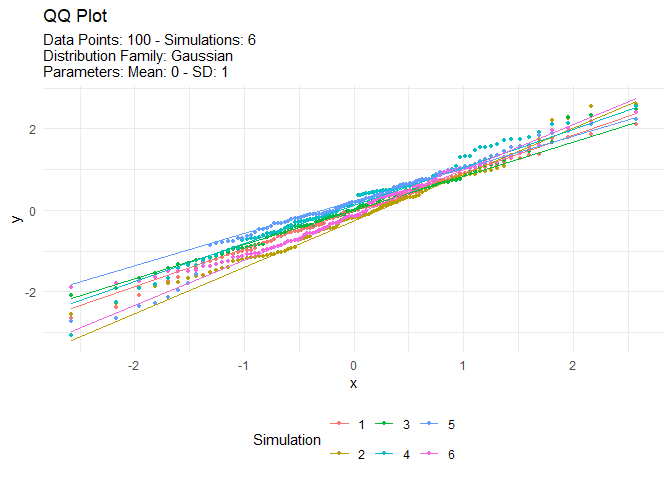
We can also take a look at the plots when the number of simulations is greater than nine. This will automatically turn off the legend as it will become too noisy.
tn <- tidy_normal(.n = 100, .num_sims = 20)

tidy_autoplot(tn, .plot_type = "density")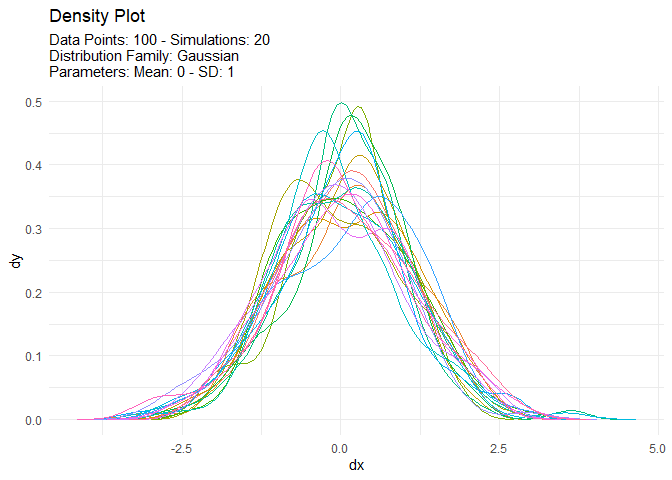
tidy_autoplot(tn, .plot_type = "quantile")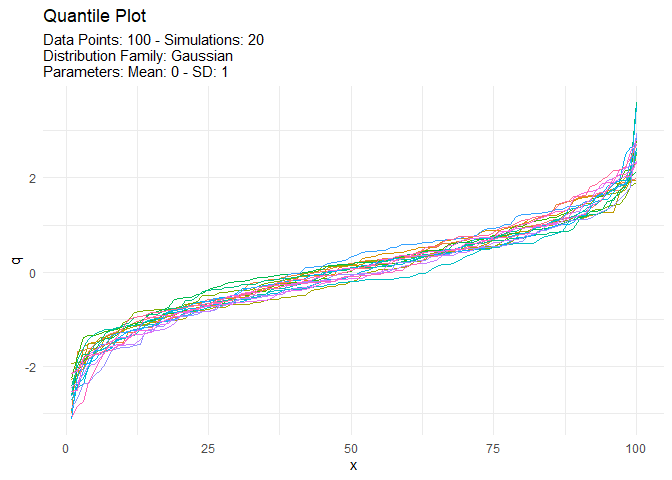
tidy_autoplot(tn, .plot_type = "probability")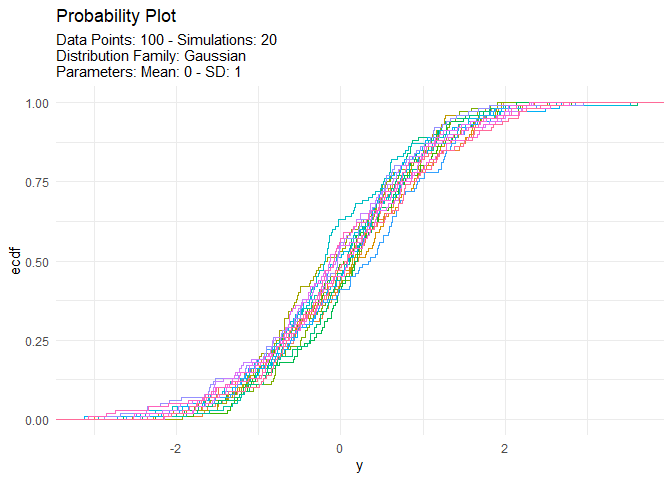
tidy_autoplot(tn, .plot_type = "qq")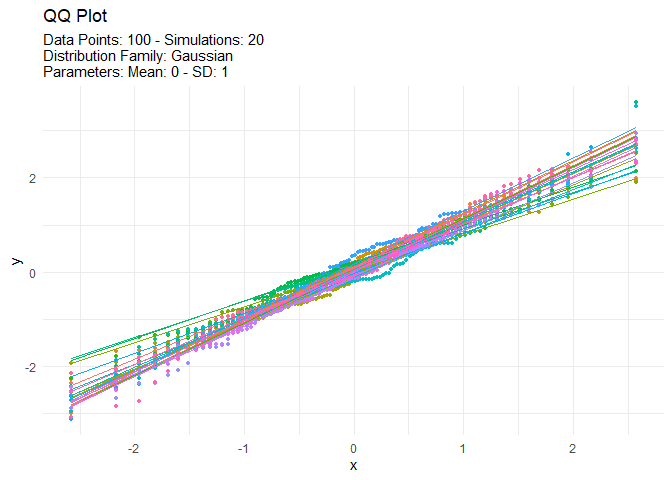
These binaries (installable software) and packages are in development.
They may not be fully stable and should be used with caution. We make no claims about them.
Health stats visible at Monitor.