The hardware and bandwidth for this mirror is donated by dogado GmbH, the Webhosting and Full Service-Cloud Provider. Check out our Wordpress Tutorial.
If you wish to report a bug, or if you are interested in having us mirror your free-software or open-source project, please feel free to contact us at mirror[@]dogado.de.
![]()
![]()
Fast, modern disease mapping. SDALGCP2 fits a
spatially discrete approximation to a log-Gaussian Cox process
(SDA-LGCP) to spatially aggregated disease counts, with
a one-line, glm-like interface and C++ speed. The method is
described in Johnson, Diggle & Giorgi (2019, Statistics in
Medicine, doi:10.1002/sim.8339).
# install.packages("remotes")
remotes::install_github("olatunjijohnson/SDALGCP2")
You need a C++ toolchain (Rtools on Windows, Xcode CLT on macOS) because the performance-critical kernels are compiled.
data is an sf object whose columns hold the
response, covariates and offset. Everything else (candidate-point
spacing, the spatial scale, MCMC settings) is chosen automatically.
library(SDALGCP2)
fit <- sdalgcp(cases ~ deprivation + offset(log(population)), data = regions)
summary(fit) # glm-style coefficient table + spatial parameters
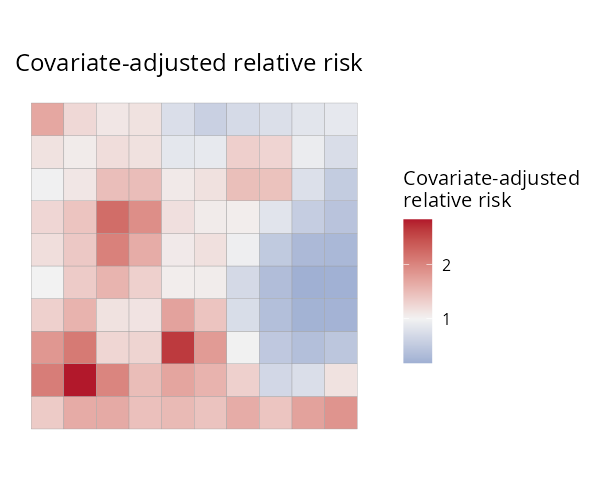
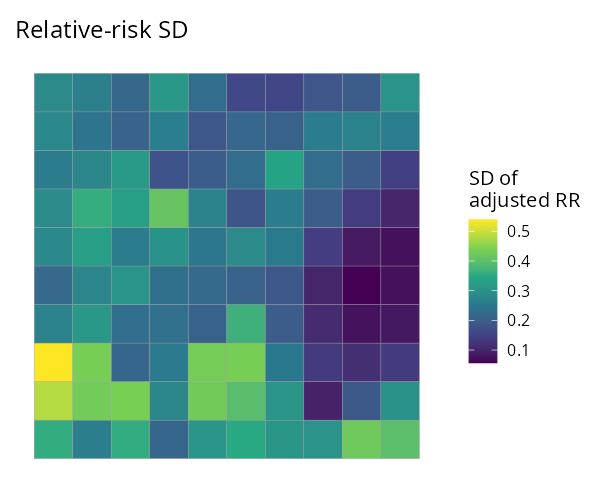
rr <- predict(fit) # an sf: relative_risk, relative_risk_se, adjusted_rr, adjusted_rr_se
plot(fit) # relative-risk map
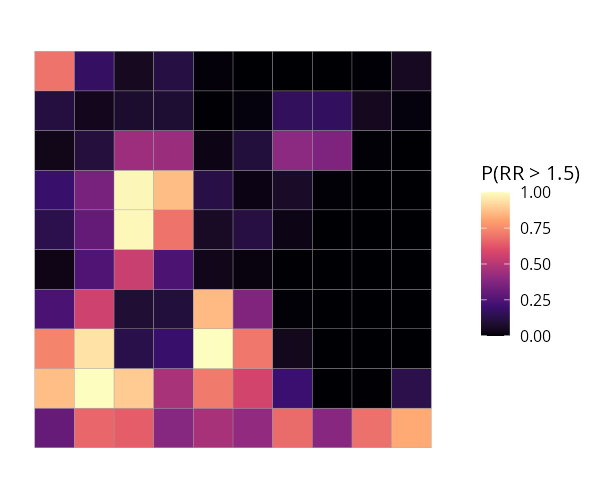
plot(fit, "exceedance", threshold = 1.5) # hotspot probabilitiesThat is the whole workflow. The same sdalgcp() call also
covers:
| You want… | Add… |
|---|---|
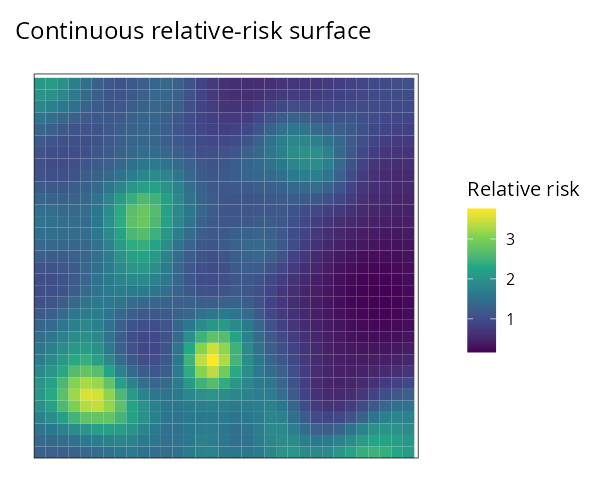
| raster (continuous) covariates | rasters = my_raster (enter on the intensity scale) |
| a spatio-temporal model | time = "year" |
| population-weighted aggregation | popden = pop_raster |
| Relative risk | Uncertainty (SD) | Exceedance P(RR > 1.5) | Continuous surface |
|---|---|---|---|
|
 |
 |
 |
sdalgcp(formula, data) — feels
like glm(); sensible defaults so a first fit needs no
tuning.φ
is optimised continuously by default (no grid), with a proper standard
error — see the derivation
PDF.(N·T)² covariance.See the package website for worked, reproducible articles:
scale = "grid") vs continuous
(scale = "continuous") φ.Johnson, O., Diggle, P. & Giorgi, E. (2019). A spatially discrete approximation to log-Gaussian Cox processes for modelling aggregated disease count data. Statistics in Medicine 38, 4871–4887.
These binaries (installable software) and packages are in development.
They may not be fully stable and should be used with caution. We make no claims about them.
Health stats visible at Monitor.