
The hardware and bandwidth for this mirror is donated by dogado GmbH, the Webhosting and Full Service-Cloud Provider. Check out our Wordpress Tutorial.
If you wish to report a bug, or if you are interested in having us mirror your free-software or open-source project, please feel free to contact us at mirror[@]dogado.de.
![]()
![]()
![]()
![]()
The goal of ‘Rthingsboard’ is to provide interaction with the API of ‘ThingsBoard’ (https://thingsboard.io/), an open-source IoT platform for device management, data collection, processing and visualization.
You can install the released version of ‘Rthingsboard’ from CRAN with:
install.packages("Rthingsboard")And the development version from GitHub with:
# install.packages("devtools")
devtools::install_github("DDorch/Rthingsboard")This is a basic example which shows you how to extract data from the following public dashboard : http://scada.g-eau.fr/dashboard/4db16100-f3e9-11e8-9dbf-cbc1e37c11e3?publicId=299cedc0-f3e9-11e8-9dbf-cbc1e37c11e3
library(Rthingsboard)# Identifier of SupAgro Halle hydraulique SCADA
url = "http://scada.g-eau.fr"
publicId = "299cedc0-f3e9-11e8-9dbf-cbc1e37c11e3"
entityId = "18d56d50-f3e9-11e8-9dbf-cbc1e37c11e3"
startDate = as.POSIXct("2020-11-19 15:00:00", tz = "Europe/Paris")
endDate = as.POSIXct("2020-11-19 18:00:00", tz = "Europe/Paris")
# Set logger threshold to DEBUG to see extra messages for debug purpose
logger::log_threshold(logger::DEBUG)First, you need to create an object of class
ThingsboardApi as follow:
# Connection to the API
tb_api = ThingsboardApi(url = url, publicId = publicId)You can get the available keys on the specified device defined by its
entityId:
# Get list of keys
keys = tb_api$getKeys(entityId = entityId)
Knowing the name of the available keys, you can get the telemetry of
this device for a given period defined by startTS and
endTS.
Here below, we download the telemetry for all keys beginning by “Y”:
df <- tb_api$getTelemetry(entityId,
                       keys = keys[grep("^Y", keys)],
                       startTs = startDate,
                       endTs = endDate)
Here below the first records of the extracted telemetry:
knitr::kable(head(df))| key | ts | value |
|---|---|---|
| Y0 | 2020-11-19 17:59:55 | 2.9683 |
| Y0 | 2020-11-19 17:59:50 | 2.7493 |
| Y0 | 2020-11-19 17:59:45 | 2.6398 |
| Y0 | 2020-11-19 17:59:40 | 2.7493 |
| Y0 | 2020-11-19 17:59:35 | 2.7493 |
| Y0 | 2020-11-19 17:59:30 | 2.7493 |
You can then record this table into a file in the current directory:
# getwd() # to get the path of the current directory
write.csv2(df, "myData.csv")
And also plot some time series:
library(ggplot2)
ggplot(df, aes(x = ts, y = value)) +
  geom_line(aes(color = key), size = 1) +
  scale_color_brewer(palette = "Set1")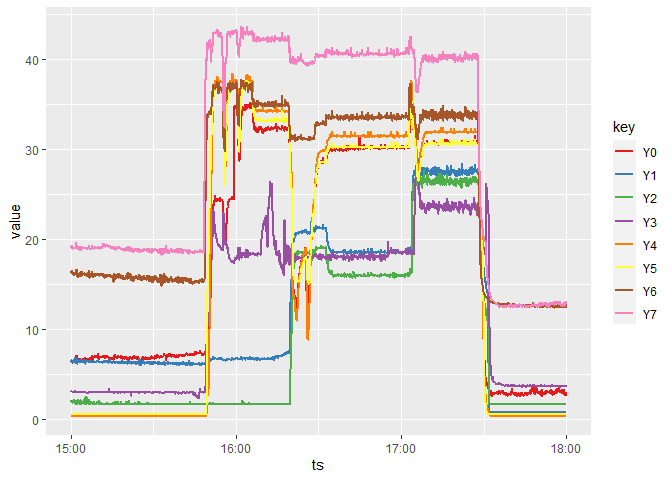
These binaries (installable software) and packages are in development.
They may not be fully stable and should be used with caution. We make no claims about them.
Health stats visible at Monitor.