
The hardware and bandwidth for this mirror is donated by dogado GmbH, the Webhosting and Full Service-Cloud Provider. Check out our Wordpress Tutorial.
If you wish to report a bug, or if you are interested in having us mirror your free-software or open-source project, please feel free to contact us at mirror[@]dogado.de.
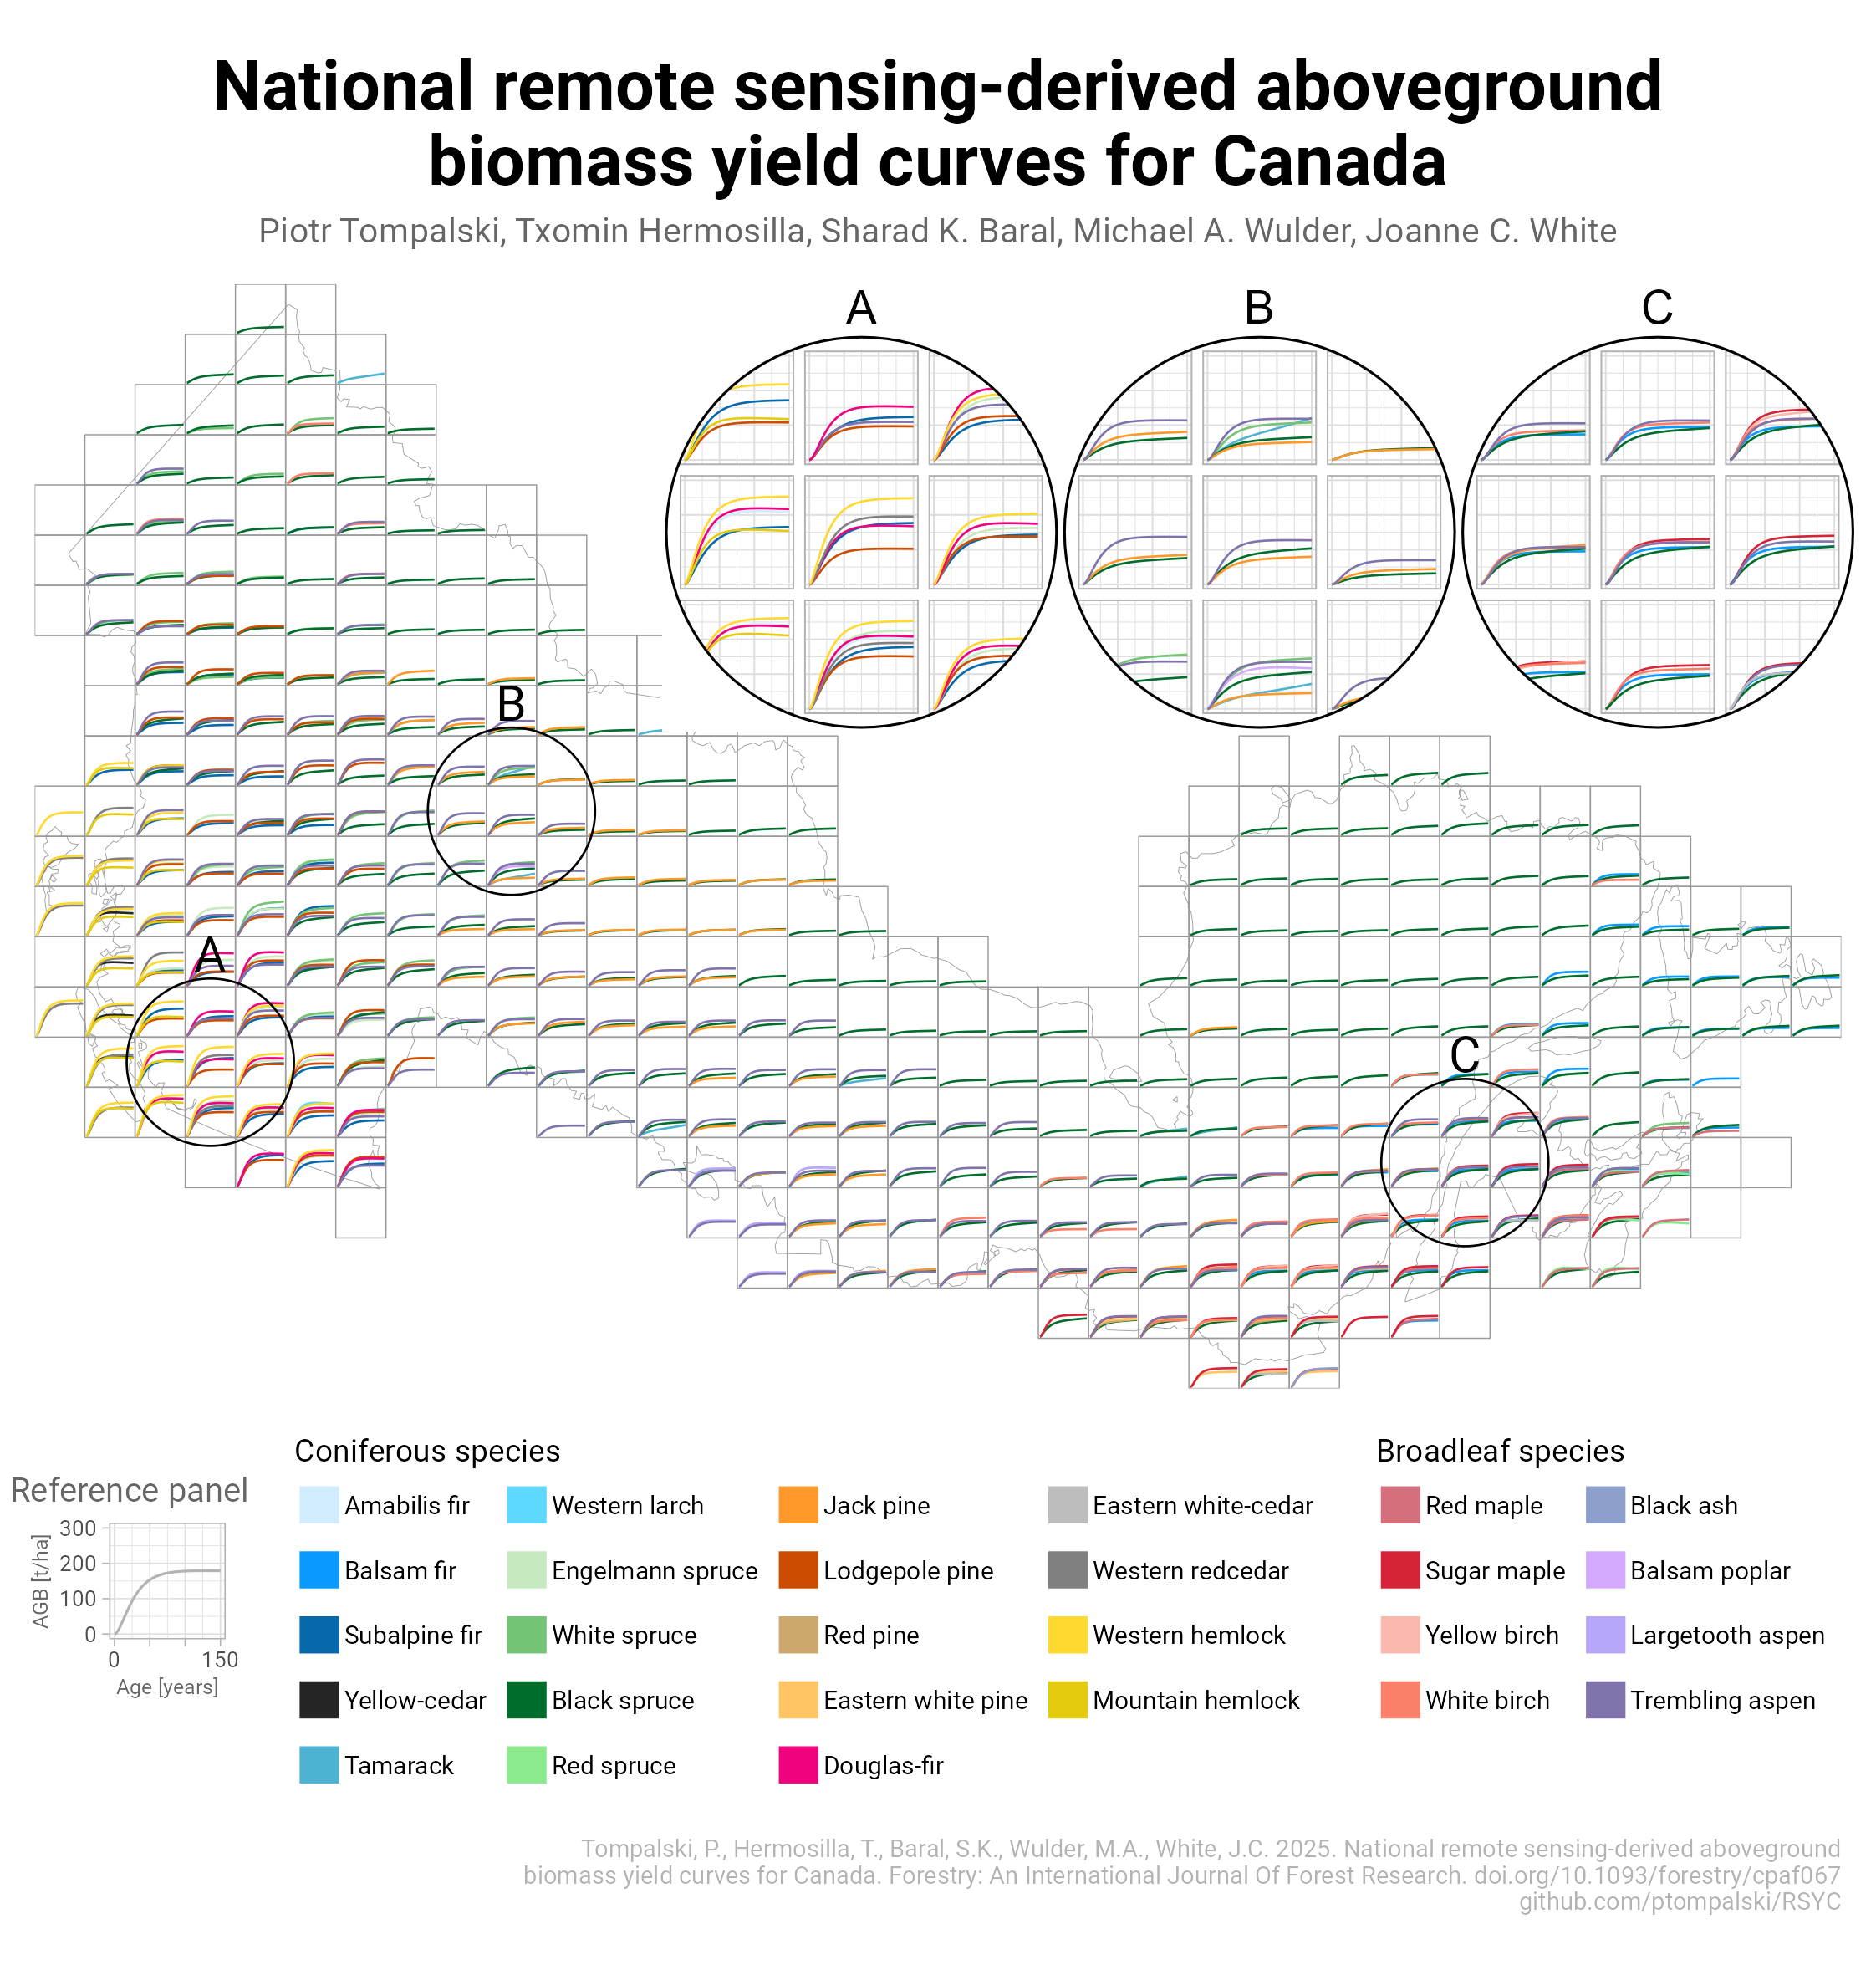
RSYC provides published yield curves for aboveground biomass (AGB,
Mg/ha) and total volume (m3/ha). Curves are available for individual
species and the generic, coniferous, and
broadleaf model groups.
Models are available for 150 x 150 km tiles and four nested ecological levels: ecozone, ecoprovince, ecoregion, and ecodistrict.
Models are periodically updated as new remote sensing data become available. The current release is v20260923.
You don’t need to install the R package to use the models. All model
parameters used in RSYC are available for direct download. The ZIP
archive contains the updated RSYC_models.csv table,
including AGB and volume models for tiles and ecological strata.
Model parameters: RSYC_models.zip
Tile grid: RSYC_tiles.gpkg
Ecological strata: RSYC_ecostrat.gpkg
The RSYC models predict aboveground biomass (AGB) or total volume as a function of stand age:
\[ y = b_1 e^{-b_4 \mathrm{Age}} (1 - e^{-b_2 \mathrm{Age}})^{b_3}. \]
where
The curves were fitted for stand ages 1 to 150 years. RSYC warns when asked to estimate outside this age range.
# install.packages("remotes")
# Development version with model release v20260923:
remotes::install_github("ptompalski/RSYC", ref = "dev")Estimate AGB for black spruce (PICE.MAR) in tile H14 at
stand ages 20, 60, and 120 years:
library(RSYC)
predict_rsyc("agb", "PICE.MAR", c(20, 60, 120), "tile", "H14")
#> [1] 26.85001 58.32616 71.92139
To estimate total volume instead, set
response = "volume":
predict_rsyc(
  response = "volume",
  species = "PICE.MAR",
  age = c(20, 60, 120),
  strata_level = "tile",
  strata_id = "H14"
)
For ecological strata, e.g. ecodistrict “Windsor Lowlands”, use the same function:
predict_rsyc(
  response = "agb",
  species = "PICE.MAR",
  age = c(20, 60, 120),
  strata_level = "ecodistrict",
  strata_id = "Windsor Lowlands"
)The following example estimates AGB and volume for several species,
stand ages, and tiles. Each row of tile_inputs describes
one estimate.
tile_inputs <- tidyr::crossing(
  response = c("agb", "volume"),
  species = c("PICE.MAR", "POPU.TRE", "coniferous"),
  age = c(20, 60, 120),
  strata_level = "tile",
  strata_id = c("H14", "F31")
) |>
  dplyr::mutate(
    prediction = purrr::pmap_dbl(
      list(response, species, age, strata_level, strata_id),
      predict_rsyc
    )
  )

tile_inputsUse the area name at the chosen ecological level when that name occurs only once.
eco_inputs <- tibble::tribble(
  ~response, ~species,   ~age, ~strata_level, ~strata_id,
  "agb",     "PICE.MAR", 80,  "ecozone",
    "Atlantic Maritime",
  "agb",     "PICE.MAR", 80,  "ecoprovince",
    "Appalachian-Acadian Highlands",
  "agb",     "PICE.MAR", 80,  "ecoregion",
    "Appalachians",
  "agb",     "PICE.MAR", 80,  "ecodistrict",
    "Windsor Lowlands"
)

eco_inputs <- eco_inputs |>
  dplyr::mutate(
    prediction = purrr::pmap_dbl(
      list(response, species, age, strata_level, strata_id),
      predict_rsyc
    )
  )

eco_inputs
The same species can have different curves at each nested ecological level. The example below shows black spruce volume curves together with the areas they represent:

The following example produces a complete set of estimates for ages 1
to 150 for each species and area listed in
curve_inputs:
curve_inputs <- tibble::tribble(
  ~response, ~species,    ~strata_level, ~strata_id,
  "agb",     "PICE.MAR",  "tile",       "H14",
  "agb",     "POPU.TRE",  "tile",       "F31",
  "volume",  "coniferous", "tile",       "N3"
)
curve_inputs <- curve_inputs |>
  dplyr::mutate(
    age = list(1:150),
    prediction = purrr::pmap(
      list(response, species, age, strata_level, strata_id),
      predict_rsyc
    )
  )

curve_inputs
#> # A tibble: 3 × 6
#>   response species    strata_level strata_id age         prediction
#>   <chr>    <chr>      <chr>        <chr>     <list>      <list>
#> 1 agb      PICE.MAR   tile         H14       <int [150]> <dbl [150]>
#> 2 agb      POPU.TRE   tile         F31       <int [150]> <dbl [150]>
#> 3 volume   coniferous tile         N3        <int [150]> <dbl [150]>

curve_predictions <- curve_inputs |>
  tidyr::unnest(c(age, prediction))
Plot the curves to compare how predicted yield changes with stand age. AGB and volume are shown separately because they use different units:
curve_predictions |>
  dplyr::mutate(
    response = factor(
      response,
      levels = c("agb", "volume"),
      labels = c("AGB (Mg/ha)", "Volume (m3/ha)")
    ),
    curve = paste(species, strata_id, sep = " - ")
  ) |>
  ggplot2::ggplot(ggplot2::aes(age, prediction, colour = curve)) +
  ggplot2::geom_line(linewidth = 0.9) +
  ggplot2::facet_wrap(ggplot2::vars(response), scales = "free_y") +
  ggplot2::labs(
    x = "Stand age (years)",
    y = "Predicted yield",
    colour = "Species and tile"
  ) +
  ggplot2::theme_minimal() +
  ggplot2::theme(legend.position = "bottom")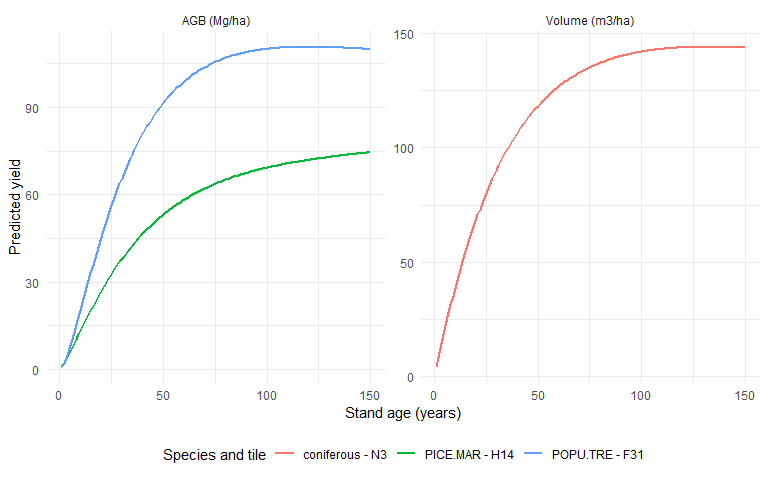
See Prediction examples for a longer walkthrough, including model-availability checks.
Three functions are provided to help identify which model to use:
available_rsyc_models() lists individual published
curves that match a response, species, type of area, or area name. For
example, list the volume curves for black spruce at the ecozone
level:available_rsyc_models(
response = "volume",
species = "PICE.MAR",
strata_level = "ecozone"
)rsyc_species() lists the species available for a
selected response and area. It also gives each species’ common name and
model group. For example, list the AGB species available in tile
H14:rsyc_species(response = "agb", strata_level = "tile", strata_id = "H14")rsyc_strata() lists the areas for which models are
available for a selected response and species. It gives both the short
area name and the full hierarchical area identifier, which can
distinguish repeated area names. For example, list the ecozones with
volume models for black spruce:rsyc_strata(
response = "volume",
species = "PICE.MAR",
strata_level = "ecozone"
)build_rsyc_dataset() prepares yield estimates and the
matching area boundaries. The boundaries are stored separately so the
same map shape is not repeated for every species and stand age. By
default, the function estimates ages 1 through 150:
dataset <- build_rsyc_dataset(
  response = "volume",
  species = c("PICE.MAR", "POPU.TRE"),
  age = 1:200,
  strata_level = "ecodistrict"
)

dataset$spatial
dataset$curves
dataset$metadata
The spatial map contains strata_id, the
ecological area names, and the area shapes. For tiles, it contains only
strata_id and the tile shapes. The curves
table records the model, area, species, stand age, and estimated yield.
The metadata table summarizes the units, model version,
equation, and choices used to create the results.
Use output = "rsyc_volume.gpkg" to save the map, yield
curves, and summary information together in one GeoPackage file.
For a visual introduction to the models, start with the RSYC overview. A second presentation, RSYC at IBFRA 2026, focuses on their use in national forest growth and carbon assessment.
If you use the RSYC package in your work, please cite the following two references:
Tompalski, P., Hermosilla, T., Baral, S.K., Wulder, M.A., White, J.C. 2025. National remote sensing-derived aboveground biomass yield curves for Canada. Forestry: An International Journal of Forest Research. https://doi.org/10.1093/forestry/cpaf067
Tompalski, P., Wulder, M.A., White, J.C., Hermosilla, T., Riofrio, J., Kurz, W.A. 2024. Developing aboveground biomass yield curves for dominant boreal tree species from time series remote sensing data. Forest Ecology and Management 561, 121894. https://doi.org/10.1016/j.foreco.2024.121894
These binaries (installable software) and packages are in development.
They may not be fully stable and should be used with caution. We make no claims about them.
Health stats visible at Monitor.