The hardware and bandwidth for this mirror is donated by dogado GmbH, the Webhosting and Full Service-Cloud Provider. Check out our Wordpress Tutorial.
If you wish to report a bug, or if you are interested in having us mirror your free-software or open-source project, please feel free to contact us at mirror[@]dogado.de.
ROCnGO provides a set of tools to study a classifier performance by using ROC curve based analysis. Package may address tasks in these type of analysis such as:
install.packages("ROCnGO")Alternatively, development version of ROCnGO can be installed from its GitHub repository with:
# install.packages("devtools")
devtools::install_github("pabloPNC/ROCnGO")library(ROCnGO)
# Iris subset
iris_subset <- iris[iris$Species != "versicolor", ]
# Select Species = "virginica" as the condition of interest
iris_subset$Species <- relevel(iris_subset$Species, "virginica")
# Summarize a predictor over high sensitivity region
summarize_predictor(
iris_subset,
predictor = Sepal.Length,
response = Species,
threshold = 0.9,
ratio = "tpr"
)
#> ℹ Upper threshold 1 already included in points.
#> • Skipping upper threshold interpolation
#> # A tibble: 1 × 5
#> auc pauc np_auc fp_auc curve_shape
#> <dbl> <dbl> <dbl> <dbl> <chr>
#> 1 0.985 0.0847 0.847 0.852 Concave
# Summarize several predictors simultaneously
summarize_dataset(
  iris_subset,
  predictors = c(Sepal.Length, Sepal.Width, Petal.Length, Petal.Width),
  response = Species,
  threshold = 0.9,
  ratio = "tpr"
)
#> ℹ Lower 0.9 and upper 1 thresholds already included in points
#> • Skipping lower and upper threshold interpolation
#> $data
#> # A tibble: 4 × 6
#>   identifier     auc   pauc np_auc fp_auc curve_shape
#>   <chr>        <dbl>  <dbl>  <dbl>  <dbl> <chr>
#> 1 Sepal.Length 0.985 0.0847 0.847   0.852 Concave
#> 2 Sepal.Width  0.166 0.0016 0.0160  0.9   Hook under chance
#> 3 Petal.Length 1     0.1    1       1     Concave
#> 4 Petal.Width  1     0.1    1       1     Concave
#>
#> $curve_shape
#> # A tibble: 2 × 2
#>   curve_shape       count
#>   <chr>             <int>
#> 1 Concave               3
#> 2 Hook under chance     1
#>
#> $auc
#> # A tibble: 2 × 3
#> # Groups:   auc > 0.5 [2]
#>   `auc > 0.5` `auc > 0.8` count
#>   <lgl>       <lgl>       <int>
#> 1 FALSE       FALSE           1
#> 2 TRUE        TRUE            3
# Plot ROC curve of classifiers
plot_roc_curve(iris_subset, predictor = Sepal.Length, response = Species) +
  add_roc_curve(iris_subset, predictor = Petal.Length, response = Species) +
  add_roc_points(iris_subset, predictor = Sepal.Width, response = Species) +
  add_chance_line()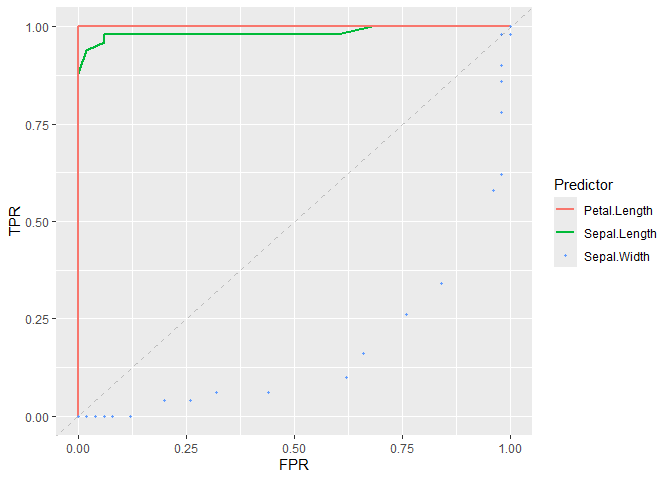
These binaries (installable software) and packages are in development.
They may not be fully stable and should be used with caution. We make no claims about them.
Health stats visible at Monitor.