
The hardware and bandwidth for this mirror is donated by dogado GmbH, the Webhosting and Full Service-Cloud Provider. Check out our Wordpress Tutorial.
If you wish to report a bug, or if you are interested in having us mirror your free-software or open-source project, please feel free to contact us at mirror[@]dogado.de.


# Install the release from CRAN:
install.packages("NACHO")

# Or install the development version from R-universe:
install.packages(
  "NACHO",
  repos = c("https://mcanouil.r-universe.dev", "https://cloud.r-project.org")
)

# Or install the latest commit from GitHub with pak:
# install.packages("pak")
pak::pak("mcanouil/NACHO")The package ships six samples of the public study GSE178516, so this
runs offline. load_rcc() reads the RCC files, computes the
quality-control metrics and normalises the counts.
library(NACHO)

data_directory <- system.file("extdata", "GSE178516", package = "NACHO")
nacho <- load_rcc(
  data_directory = data_directory,
  ssheet_csv = file.path(data_directory, "samplesheet.csv"),
  id_colname = "IDFILE",
  instrument = "max",
  n_comp = 5
)
#> ℹ Reading 6 RCC files
#> ✔ Reading 6 RCC files [25ms]
#>
#> ℹ Assembling 6 samples
#> ✔ Assembling 6 samples [18ms]
#>
#> ℹ Computing quality-control metrics and normalising
#> ✔ Computing quality-control metrics and normalising [24ms]
#>
nacho_qc(nacho)[, c("IDFILE", "status", "n_flags", "reason")]
#>                  IDFILE status n_flags reason
#> 1 GSM5393247_S02.RCC.gz   pass       0   <NA>
#> 2 GSM5393248_S13.RCC.gz   pass       0   <NA>
#> 3 GSM5393250_S15.RCC.gz   pass       0   <NA>
#> 4 GSM5393251_S16.RCC.gz   pass       0   <NA>
#> 5 GSM5393267_S46.RCC.gz   pass       0   <NA>
#> 6 GSM5393268_S47.RCC.gz   pass       0   <NA>
autoplot() draws any quality-control figure,
render() writes a report with Quarto, and
visualise() opens the app.
autoplot(nacho, type = "BD")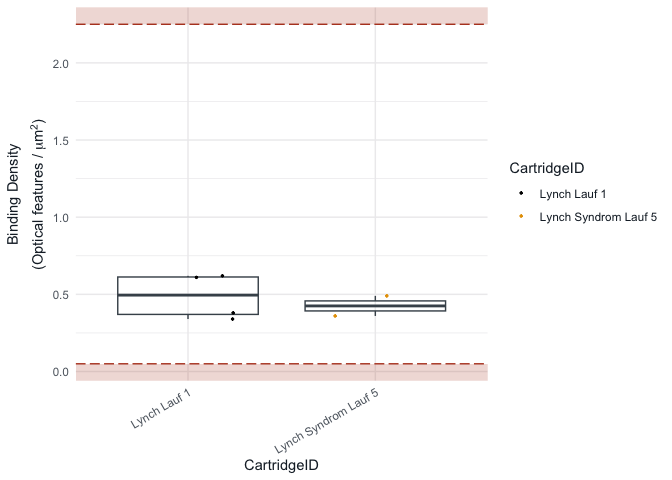
render(nacho, output_dir = tempdir())
visualise(nacho)NACHO works with NanoString nCounter data. It reads the RCC files, flags the samples that fail quality control and normalises the counts.
load_rcc() reads the RCC files and a sample sheet,
computes the quality-control metrics and normalises the counts.visualise() opens a Shiny app to look at every metric
and change the limits.autoplot() draws any quality-control figure as a
ggplot2 plot.render() writes a quality-control report with Quarto,
as an HTML or a PDF file.normalise() runs the normalisation again with new
settings.The package website shows the app, the report and a full analysis.
Open the app on a nacho object with
visualise().
visualise(GSE74821)
The articles “Explore quality control in the app” and “Analyse a GEO study” on the package website show each page of the app and a full analysis of GSE178516. The article “Moving from NACHO 2” on the same website maps the NACHO 2 code to NACHO 3.
Canouil, M., Bouland, G. A., Bonnefond, A., Froguel, P., ’t Hart, L. M., & Slieker, R. C. (2020). “NACHO: an R package for quality control of NanoString nCounter data”. Bioinformatics, 36(3), 970-971. doi: 10.1093/bioinformatics/btz647
@Article{Canouil2020,
  title = {{NACHO}: an {R} package for quality control of {NanoString} {nCounter} data},
  author = {Mickaël Canouil and Gerard A. Bouland and Amélie Bonnefond and Philippe Froguel and Leen M. {'t Hart} and Roderick C. Slieker},
  journal = {Bioinformatics},
  year = {2020},
  month = {feb},
  volume = {36},
  number = {3},
  pages = {970--971},
  issn = {1367-4803},
  doi = {10.1093/bioinformatics/btz647},
}If you encounter a clear bug, please file a minimal reproducible
example on GitHub.
For questions and other discussion, please contact the package
maintainer.
Please note that this project is released with a Contributor
Code of Conduct.
By contributing to this project, you agree to abide by its terms.
These binaries (installable software) and packages are in development.
They may not be fully stable and should be used with caution. We make no claims about them.
Health stats visible at Monitor.