
The hardware and bandwidth for this mirror is donated by dogado GmbH, the Webhosting and Full Service-Cloud Provider. Check out our Wordpress Tutorial.
If you wish to report a bug, or if you are interested in having us mirror your free-software or open-source project, please feel free to contact us at mirror[@]dogado.de.
This R package implements the Mapper algorithm for topological data analysis (TDA). The Mapper algorithm facilitates visualisation and analysis of high-dimensional data by constructing a simplicial complex that represents the data’s underlying structure. The package offers the standard Mapper F-Mapper and G-Mapper algorithms, in addition to multiple clustering methods and visualisation tools.
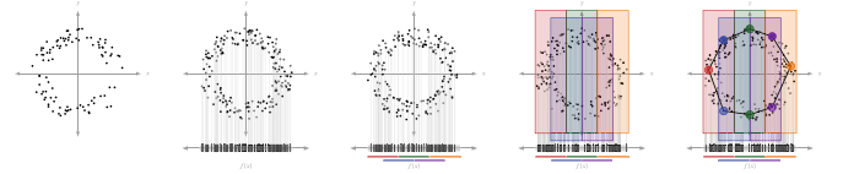 Step visualize from
Skaf et al.
Step visualize from
Skaf et al.
Mapper is basically a three-step process:
1. Cover: This step splits the data into overlapping intervals and creates a cover for the data.
2. Cluster: This step clusters the data points in each interval the cover creates.
3. Simplicial Complex: This step combines the two steps above to connect the data points in the cover, creating a simplicial complex.
You can learn more about the basics here: Chazal, F., & Michel, B. (2021). An introduction to topological data analysis: fundamental and practical aspects for data scientists. Frontiers in artificial intelligence, 4, 667963.
More examples could be found in inst/example with
function applications. For a more detailed explanation of this package,
this document
will be kept updated for better understanding of the source code.
data <- get(data("iris"))

Mapper <- MapperAlgo(
  data[,1:4],
  filter_values = data[,1:3],
  percent_overlap = 20,
  methods = "kmeans",
  method_params = list(max_kmeans_clusters = 2),
  cover_type = 'stride',
  interval_width = 1,
  num_cores = 12
  )
FMapper <- FuzzyMapperAlgo(
  original_data = data[,1:4],
  filter_values =  data[,1:2],
  cluster_n = 8,
  fcm_threshold = 0.2,
  methods = "kmeans",
  method_params = list(max_kmeans_clusters = 2)
)
GMapper <- GMapperAlgo(
  data[,1:4],
  filter_values = data[,1],
  AD_threshold = 0.8,
  g_overlap = 0.5,
  methods = "kmeans",
  method_params = list(max_kmeans_clusters = 2),
  num_cores = 12
)

MapperPlotter(Mapper, label=data$Species, avg=FALSE, use_embedding=FALSE)
MapperPlotter(FMapper, label=data$Species, avg=FALSE, use_embedding=FALSE)
MapperPlotter(GMapper, label=data$Species, avg=FALSE, use_embedding=FALSE)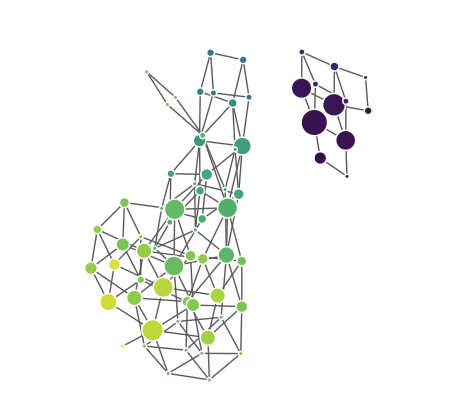 |
 |
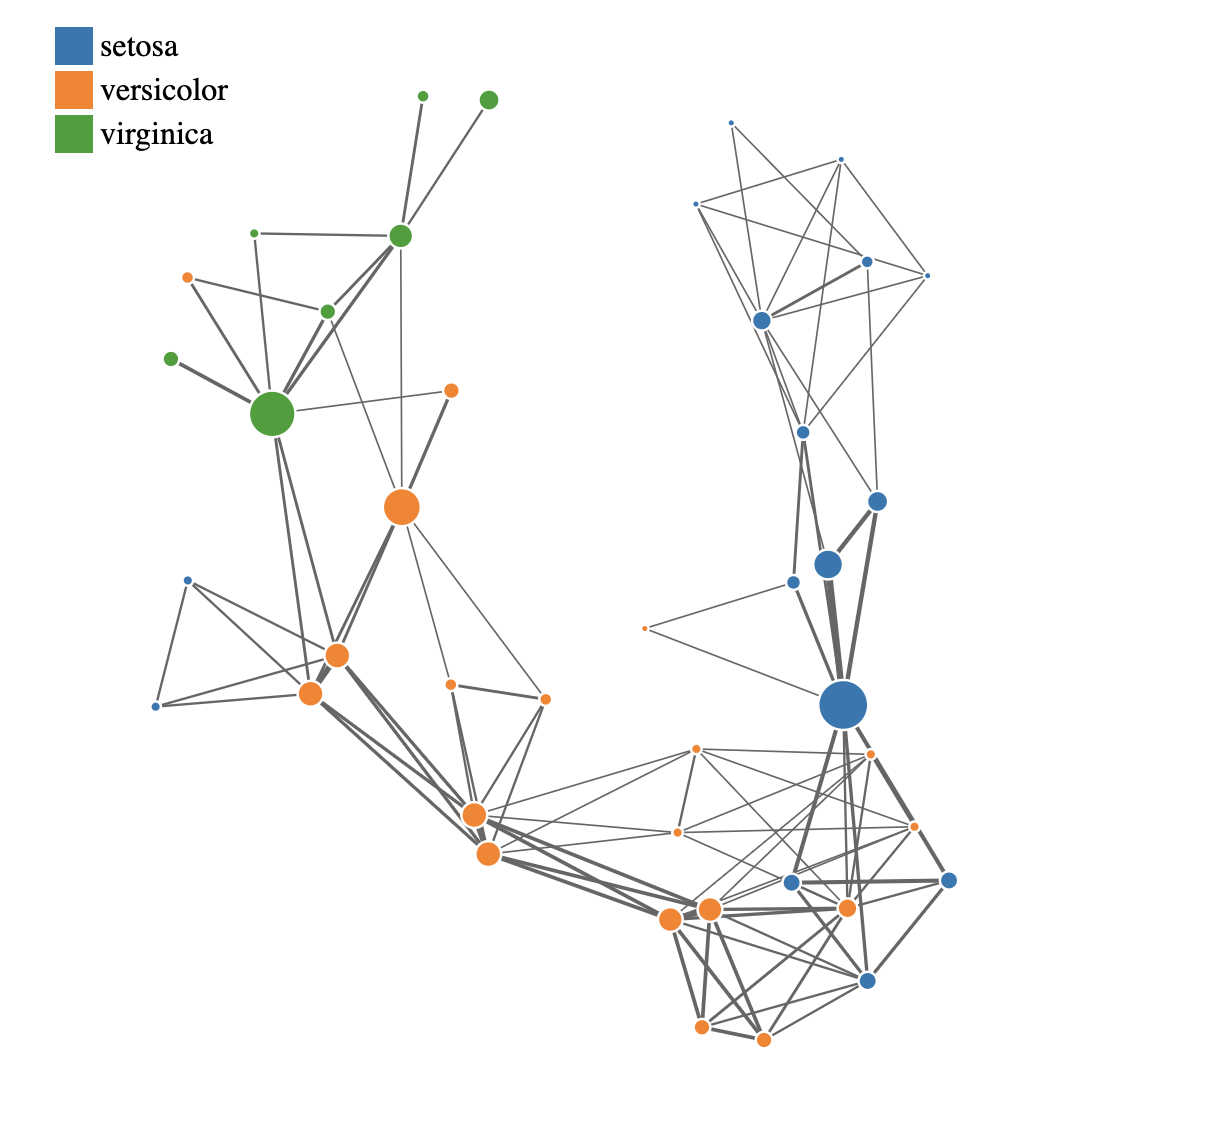 |
|---|---|---|
| Mapper | F-Mapper | G-Mapper |
You can try the interactive frontend in tda frontend. To visualise
your own data, upload a JSON file formatted as shown below. The
cc is optional; you can ignore it unless you have
pre-calculated labels. Any feedback is welcome; please send it to
kennywang2003@gmail.com or add an issue.
library(jsonlite)

export_data <- list(
  adjacency = Mapper$adjacency,
  num_vertices = Mapper$num_vertices,
  level_of_vertex = Mapper$level_of_vertex,
  points_in_vertex = Mapper$points_in_vertex,
  original_data = as.data.frame(all_features),
  # This is the label that is already calculated for each node (optional)
  cc = tibble(
    eigen_centrality = e_scores,
    betweenness = b_scores
  )
)
write(toJSON(export_data, auto_unbox = TRUE), "~/desktop/frontend.json")
These binaries (installable software) and packages are in development.
They may not be fully stable and should be used with caution. We make no claims about them.
Health stats visible at Monitor.