The hardware and bandwidth for this mirror is donated by dogado GmbH, the Webhosting and Full Service-Cloud Provider. Check out our Wordpress Tutorial.
If you wish to report a bug, or if you are interested in having us mirror your free-software or open-source project, please feel free to contact us at mirror[@]dogado.de.
![]()
The DoseFinding package provides functions for the design and analysis of dose-finding experiments (for example pharmaceutical Phase II clinical trials). It provides functions for: multiple contrast tests, fitting non-linear dose-response models, a combination of testing and dose-response modelling and calculating optimal designs, both for normal and general response variable.
You can install the development version of DoseFinding from GitHub with:
# install.packages("devtools")
devtools::install_github("bbnkmp/DoseFinding")library(DoseFinding)
data(IBScovars)
## set random seed to ensure reproducible adj. p-values for multiple contrast test
set.seed(12)
## perform (model based) multiple contrast test
## define candidate dose-response shapes
models <- Mods(linear = NULL, emax = 0.2, quadratic = -0.17,
doses = c(0, 1, 2, 3, 4))
## plot models
plot(models)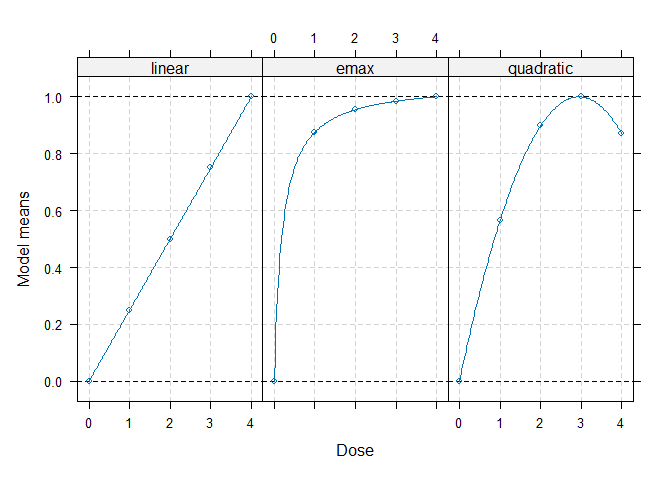
## perform multiple contrast test
MCTtest(dose, resp, IBScovars, models=models,
                addCovars = ~ gender)
#> Multiple Contrast Test
#>
#> Contrasts:
#>   linear   emax quadratic
#> 0 -0.616 -0.889    -0.815
#> 1 -0.338  0.135    -0.140
#> 2  0.002  0.226     0.294
#> 3  0.315  0.252     0.407
#> 4  0.638  0.276     0.254
#>
#> Contrast Correlation:
#>           linear  emax quadratic
#> linear     1.000 0.768     0.843
#> emax       0.768 1.000     0.948
#> quadratic  0.843 0.948     1.000
#>
#> Multiple Contrast Test:
#>           t-Stat   adj-p
#> emax       3.208 0.00128
#> quadratic  3.083 0.00228
#> linear 2.640 0.00848## fit non-linear emax dose-response model
fitemax <- fitMod(dose, resp, data=IBScovars, model="emax",
bnds = c(0.01,5))
## display fitted dose-effect curve
plot(fitemax, CI=TRUE, plotData="meansCI")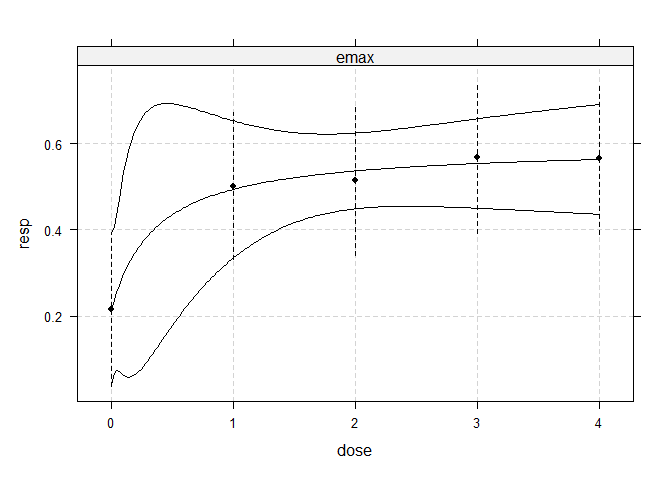
## Calculate optimal designs for target dose (TD) estimation
doses <- c(0, 10, 25, 50, 100, 150)
fmodels <- Mods(linear = NULL, emax = 25, exponential = 85,
                logistic = c(50, 10.8811),
                doses = doses, placEff=0, maxEff=0.4)
plot(fmodels, plotTD = TRUE, Delta = 0.2)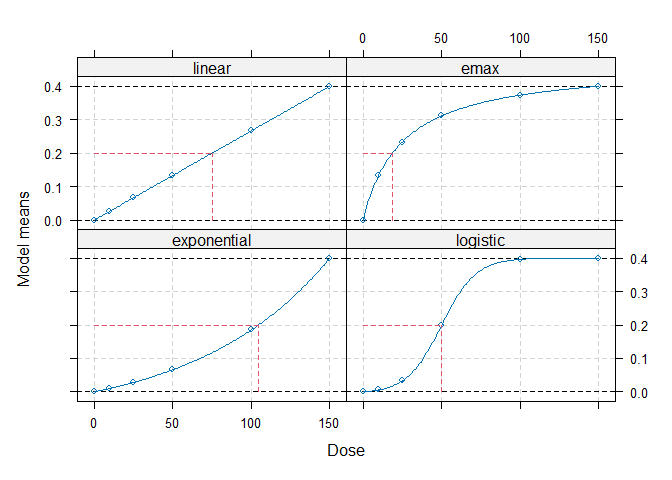
weights <- rep(1/4, 4)
optDesign(fmodels, weights, Delta=0.2, designCrit="TD")
#> Calculated TD - optimal design:
#>       0      10      25      50     100     150
#> 0.34960 0.09252 0.00366 0.26760 0.13342 0.15319
These binaries (installable software) and packages are in development.
They may not be fully stable and should be used with caution. We make no claims about them.
Health stats visible at Monitor.