The hardware and bandwidth for this mirror is donated by dogado GmbH, the Webhosting and Full Service-Cloud Provider. Check out our Wordpress Tutorial.
If you wish to report a bug, or if you are interested in having us mirror your free-software or open-source project, please feel free to contact us at mirror[@]dogado.de.


From first look to reproducible report.
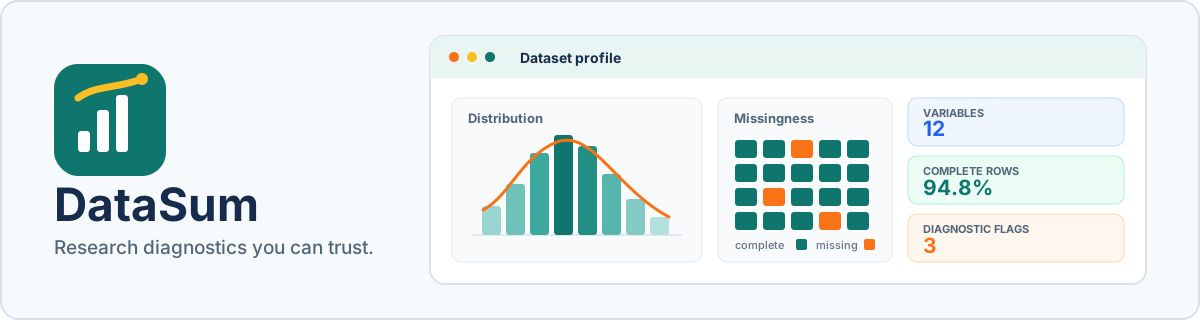
DataSum is an R toolkit for rigorous first-pass data diagnostics. It helps statisticians, researchers, professors, scientists, and students move from a raw data frame to transparent summaries, quality warnings, distribution checks, group comparisons, and reproducible reports.
Release status: GitHub contains the new DataSum 1.0 API. CRAN currently serves the legacy 0.1.1 release, so install from GitHub to use the functions documented below.
install.packages("remotes")
remotes::install_github("Uzairkhan11w/DataSum")

library(DataSum)

summary <- summarize_data(iris, by = "Species", digits = 3)
profile <- profile_data(iris)
profile$warnings| Capability | What it answers |
|---|---|
| NA-aware summaries | How much usable data is present in every variable? |
| Robust statistics | What do median, IQR, MAD, skewness, and excess kurtosis reveal? |
| Mode handling | Are there tied modes, and how frequent are they? |
| Outlier diagnostics | Which variables exceed the transparent 1.5 x IQR rule? |
| Normality diagnostics | Which test ran, what was its p-value, and what does the decision mean? |
| Grouped profiles | How do variables differ across treatments, classes, or cohorts? |
| Analyst warnings | Which missingness, duplicate, outlier, or distribution issues need attention? |
| Reproducible reports | Can the diagnostic record be shared as Quarto HTML, PDF, or DOCX? |
| Interactive app | Can a non-programmer upload a CSV and explore the same diagnostics? |
| Function | Purpose |
|---|---|
summarize_vector() |
One-row diagnostic summary for a single vector |
summarize_data() |
One row per variable, optionally within groups |
profile_data() |
Dataset overview, variable summaries, and warnings |
datasum_report() |
Quarto diagnostic report source and optional rendering |
run_datasum_app() |
Interactive Shiny interface |
summarize_vector(
  c(12, 14, 14, 16, NA, 21, 45),
  name = "response_time",
  digits = 2
)

summarize_data(iris, by = "Species", digits = 2)

profile <- profile_data(airquality, digits = 2)
profile$dataset
profile$summary
profile$warnings
Normality output is deliberately cautious. DataSum reports evidence against normality or no evidence against normality; it does not claim that a sample has proven a population distribution.
run_datasum_app()The Shiny app opens in your browser and provides:
This launches locally on your computer. A public hosted version is part of the project roadmap.
Create a portable Quarto source file without extra software:
report <- datasum_report(
  iris,
  path = "iris-diagnostic-report.qmd",
  format = "qmd",
  render = FALSE
)
With the optional quarto package and Quarto CLI
installed, render directly:
datasum_report(
  iris,
  path = "iris-diagnostic-report.html",
  format = "html",
  render = TRUE
)
The report contains the dataset overview, variable diagnostics, analyst warnings, formula definitions, and interpretation guidance.
GitHub displays a Cite this repository button from
CITATION.cff. From R, you can also run:
citation("DataSum")DataSum is being built in public. Bug reports, statistical-method discussions, teaching use cases, documentation improvements, and research workflow ideas are welcome through GitHub Issues.
DataSum is diagnostic software, not a substitute for study design, domain expertise, or model-specific assumption checking.
These binaries (installable software) and packages are in development.
They may not be fully stable and should be used with caution. We make no claims about them.
Health stats visible at Monitor.