CytOpT
The hardware and bandwidth for this mirror is donated by dogado GmbH, the Webhosting and Full Service-Cloud Provider. Check out our Wordpress Tutorial.
If you wish to report a bug, or if you are interested in having us mirror your free-software or open-source project, please feel free to contact us at mirror[@]dogado.de.
CytOpT
![]()
![]()
CytOpT uses regularized optimal transport to directly
estimate the different cell population proportions from a biological
sample characterized with flow cytometry measurements.
CytOpT is an R package that provides a new
algorithm relying regularized optimal transport to directly estimate the
different cell population proportions from a biological sample
characterized with flow cytometry measurements. Algorithm is based on
the regularized Wasserstein metric to compare cytometry measurements
from different samples, thus accounting for possible mis-alignment of a
given cell population across sample (due to technical variability from
the technology of measurements).
The main function of the package is CytOpT().
The methods implemented in this package are detailed in the following article:
Paul Freulon, Jérémie Bigot, Boris P. Hejblum. CytOpT: Optimal Transport with Domain Adaptation for Interpreting Flow Cytometry data. Annals of Applied Statistics, 17(2), 1086-1104. doi:10.1214/22-AOAS1660 https://doi.org/10.1214/22-AOAS1660 https://arxiv.org/abs/2006.09003
You can install and load CytOpT into R from
CRAN
with the following commands:
install.packages("CytOpT")
library(CytOpT)
Alternatively, you can install the development version of CytOpT like so:
remotes::install_github("sistm/CytOpT-R")
library(CytOpT)This is a basic example of CytOpt usage:
library(CytOpT)
# Load source Data
data("HIPC_Stanford")
# Define the true proportions in the target data set
gold_standard_manual_prop <- c(table(HIPC_Stanford_1369_1A_labels)/length(HIPC_Stanford_1369_1A_labels))# Run CytOpt and compare the two optimization methods
res <- CytOpT(X_s = HIPC_Stanford_1228_1A, X_t = HIPC_Stanford_1369_1A,
Lab_source = HIPC_Stanford_1228_1A_labels,
theta_true = gold_standard_manual_prop,
eps = 0.0001, lbd = 0.0001, n_iter = 10000, n_stoc=10,
step_grad = 10, step = 5, power = 0.99,
method='both', monitoring=TRUE)
#> Converting `X_s` from data.frame to matrix type
#> Converting `X_t` from data.frame to matrix type
#> Running Descent-ascent optimization...
#> Done in 41 secs
#> Running MinMax optimization...
#> Done in 13.1 secssummary(res)
#> Estimation of cell proportions with Descent-Ascent and MinMax swapping from CytOpt:
#> Gold_standard Descent_ascent MinMax
#> CD8 Effector 0.017004001 0.053759778 0.047393221
#> CD8 Naive 0.128736173 0.088769005 0.107816158
#> CD8 Central Memory 0.048481996 0.038397834 0.033566658
#> CD8 Effector Memory 0.057484114 0.063361303 0.065816317
#> CD8 Activated 0.009090374 0.018372778 0.009994826
#> CD4 Effector 0.002324076 0.008558555 0.004906936
#> CD4 Naive 0.331460344 0.342921952 0.342097994
#> CD4 Central Memory 0.281713344 0.214043702 0.194972841
#> CD4 Effector Memory 0.102082843 0.157122353 0.185355840
#> CD4 Activated 0.021622735 0.014692740 0.008079209
#>
#> Final Kullback-Leibler divergences:
#> Descent-Ascent MinMax swapping
#> 0.06512061 0.07230307
#> Number of iterations:
#> Descent-Ascent MinMax swapping
#> 5000 10000plot(res)
#> Plotting KL divergence for iterations 10 to 1000 while there were at least 5000 iterations performed for each method.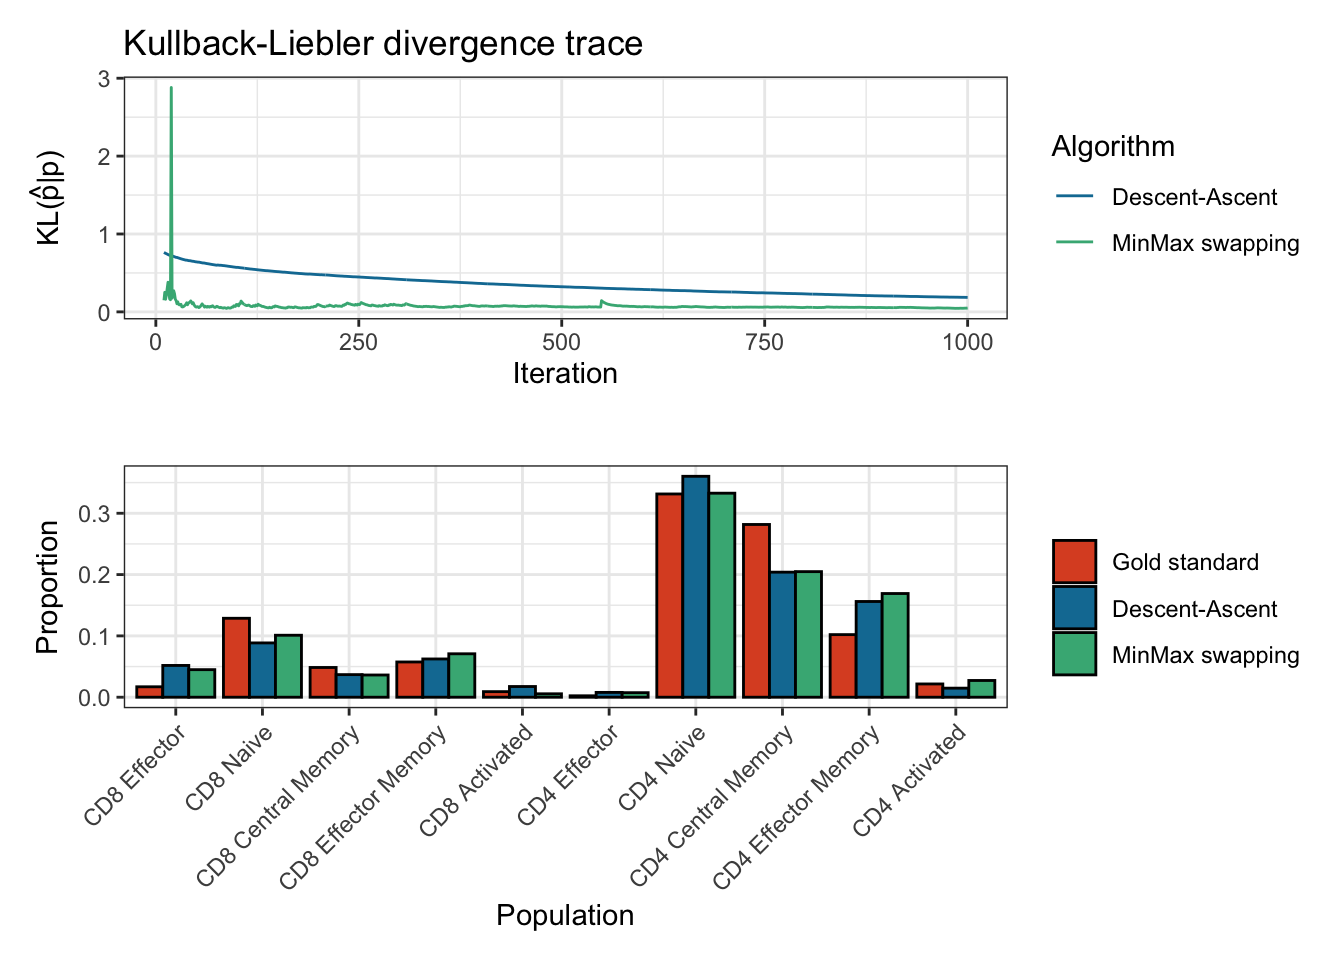
Bland_Altman(res$proportions)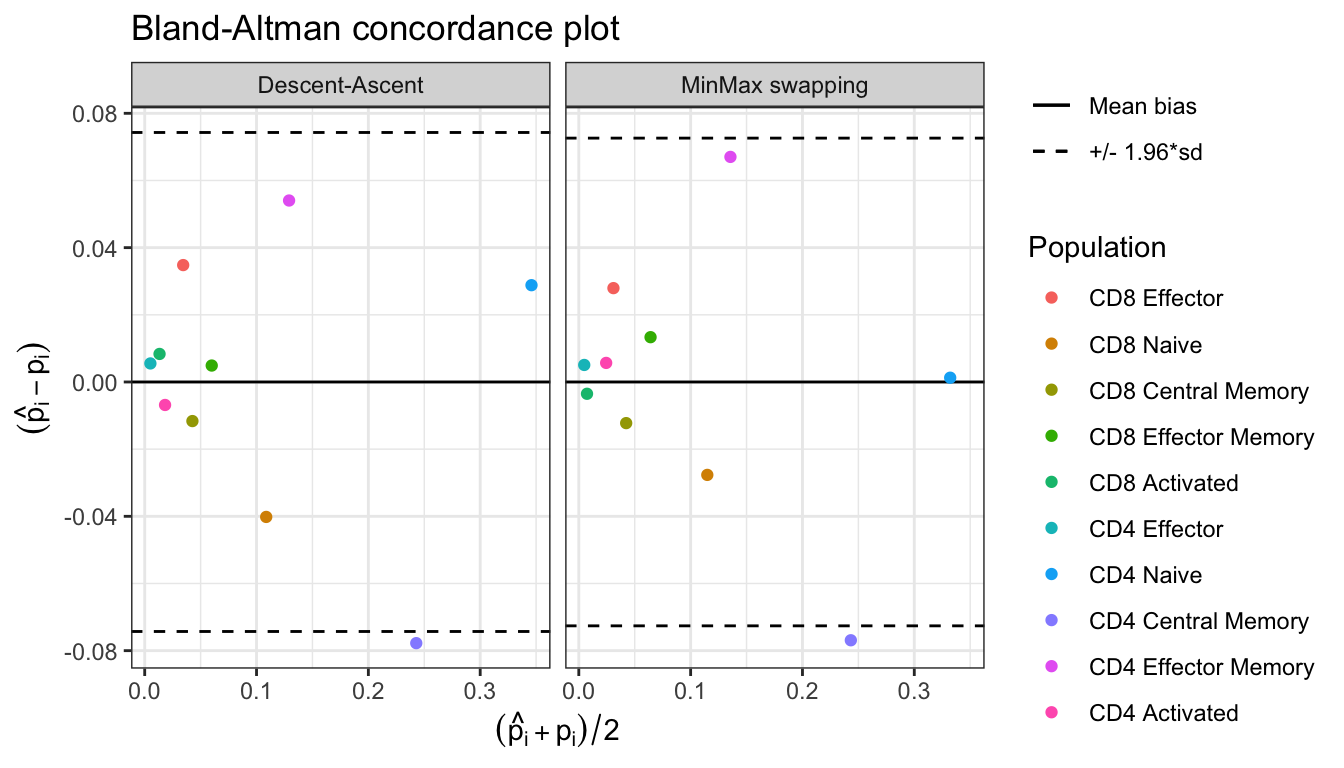
These binaries (installable software) and packages are in development.
They may not be fully stable and should be used with caution. We make no claims about them.
Health stats visible at Monitor.