The hardware and bandwidth for this mirror is donated by dogado GmbH, the Webhosting and Full Service-Cloud Provider. Check out our Wordpress Tutorial.
If you wish to report a bug, or if you are interested in having us mirror your free-software or open-source project, please feel free to contact us at mirror[@]dogado.de.
Cure dependent censoring regression models for long-term survival multivariate data.
You can install the development version of CureDepCens from GitHub with:
install.packages("devtools")
devtools::install_github("GabrielGrandemagne/CureDepCens")This is a basic example which shows you how to solve a common problem:
library(devtools)
#> Carregando pacotes exigidos: usethis
library(CureDepCens)
load_all()
#> ℹ Loading CureDepCens
Dogs_MimicData <- Dogs_MimicData
delta_t = ifelse(Dogs_MimicData$cens==1,1,0)
delta_c = ifelse(Dogs_MimicData$cens==2,1,0)

# MEP
fit <- cure_dep_censoring(formula = time ~ x1_cure + x2_cure | x_c1 + x_c2,
                           data = Dogs_MimicData,
                           delta_t = delta_t,
                           delta_c = delta_c,
                           ident = Dogs_MimicData$ident,
                           dist = "mep")
summary_cure(fit)
#>
#> MEP approach
#>
#> Name  Estimate    Std. Error  CI INF      CI SUP      p-value
#> Alpha    2.034930    0.2005083   1.641933    2.427926    3.044e-26
#> Theta    0.7787554   0.4238412   0.000000    1.609484
#>
#> Coefficients Cure:
#>
#> Name  Estimate    Std. Error  CI INF      CI SUP      p-value
#> Interc   -0.6976047  0.1781988   -1.046874   -0.3483351  7.141e-33
#> x1_cur   0.514533    0.1703999   0.1805492   0.8485168   7.419e-18
#> x2_cur   0.2017428   0.08103922  0.04290593  0.3605797   0.001578
#>
#> Coefficients C:
#>
#> Name  Estimate    Std. Error  CI INF      CI SUP      p-value
#> x_c1 0.03219111  0.1625781   -0.286462   0.3508442   0.1122
#> x_c2 -0.318467   0.1609394   -0.6339082  -0.003025754    4.682e-12
#>
#> ----------------------------------------------------------------------------------
#>
#> Information criteria:
#>
#> AIC   BIC      HQ
#> 510.9032 574.7666 536.194
Dogs_MimicData is our simulated data frame. For more information check the documentation for stored datasets.
head(Dogs_MimicData)
#> u v t c time event int x1_cure
#> 1 0.56788087 0.83359383 0.4131564 0.3614745 0.3614745 0 1 0
#> 2 0.66013804 0.72909631 1.0968927 2.1033648 1.0968927 1 1 1
#> 3 0.06854872 0.63332194 Inf 1.6510975 1.6510975 0 1 1
#> 4 0.88345952 0.57152197 0.6522436 8.6456149 0.6522436 1 1 1
#> 5 0.45431855 0.92452776 0.9258282 0.5216269 0.5216269 0 1 1
#> 6 0.12120571 0.02350277 Inf 10.9070711 5.1121398 0 1 1
#> x2_cure x_c1 x_c2 cens ident
#> 1 0.5228382 1.0403070 0 2 1
#> 2 -0.4207129 0.1071675 1 1 2
#> 3 -1.1207319 -1.4042911 0 2 3
#> 4 1.1764416 -0.7740067 1 1 4
#> 5 0.3891404 0.4973770 1 2 5
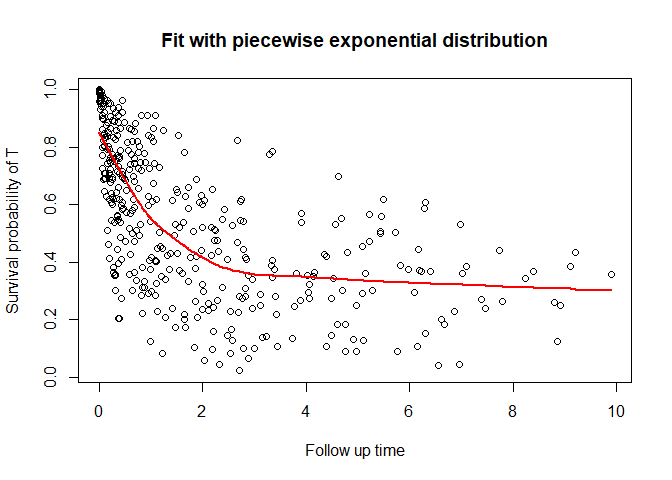
#> 6 0.5580893 -0.2278904 1 3 6You can also plot the survival function
plot_cure(fit, scenario = "t")
These binaries (installable software) and packages are in development.
They may not be fully stable and should be used with caution. We make no claims about them.
Health stats visible at Monitor.