The hardware and bandwidth for this mirror is donated by dogado GmbH, the Webhosting and Full Service-Cloud Provider. Check out our Wordpress Tutorial.
If you wish to report a bug, or if you are interested in having us mirror your free-software or open-source project, please feel free to contact us at mirror[@]dogado.de.
This is an R package that provides simple functions for creating contour plots.
The main functions are:
cf_grid: Makes a contour plot from grid
data.
cf_func: Makes a contour plot for a
function.
cf_data: Makes a contour plot for a data set by
fitting a Gaussian process model.
cf: Passes arguments to cf_function or
cf_data depending on whether the first argument is a
function or numeric.
All of these functions make the plot using base graphics by default.
To make plots using ggplot2, add the argument gg=TRUE, or
put g in front of the function name. E.g., gcf_data(...) is
the same as cf_data(..., gg=TRUE), and makes a similar plot
to cf_data but using ggplot2.
There are two functions for making plots in higher dimensions:
cf_4dim: Plots functions with four inputs by making
a series of contour plots.
cf_highdim: Plots for higher dimensional inputs by
making a contour plot for each pair of input dimensions and holding the
other inputs constant or averaging over them.
# It can be installed like any other package
install.packages("ContourFunctions")

# Or the the development version from GitHub:
# install.packages("devtools")
devtools::install_github("CollinErickson/contour")Plot a grid of data:
library(ContourFunctions)
a <- b <- seq(-4*pi, 4*pi, len = 27)
r <- sqrt(outer(a^2, b^2, "+"))
cf_grid(a, b, cos(r^2)*exp(-r/(2*pi)))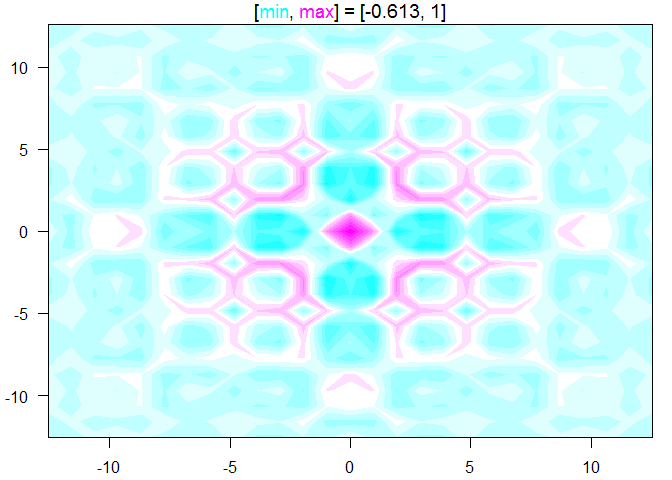
Plot a function with two input dimensions:
f1 <- function(r) cos(r[1]^2 + r[2]^2)*exp(-sqrt(r[1]^2 + r[2]^2)/(2*pi))
cf_func(f1, xlim = c(-4*pi, 4*pi), ylim = c(-4*pi, 4*pi))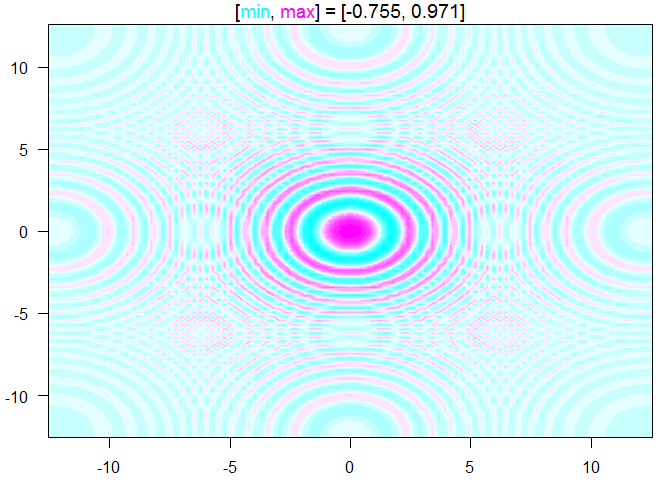
Using data with two inputs and an output, fit a Gaussian process model and show the contour surface with dots where the points are:
set.seed(0)
x <- runif(20)
y <- runif(20)
z <- exp(-(x-.5)^2-5*(y-.5)^2)
cf_data(x,y,z)
#> Fitting with laGP since n <= 200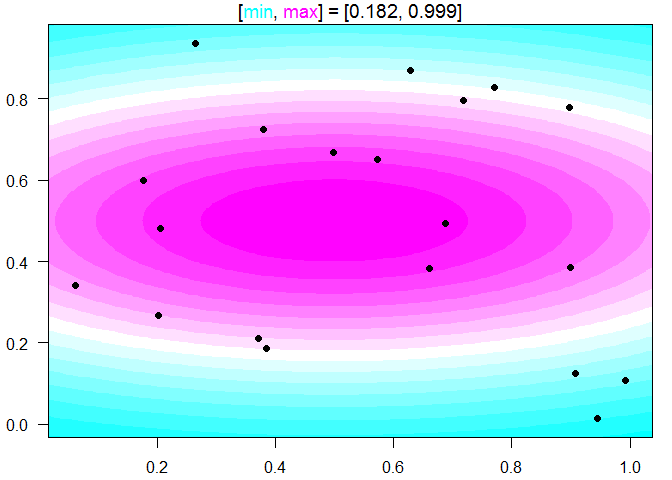
For more than two input dimensions:
friedman <- function(x) {
  10*sin(pi*x[1]*x[2]) + 20*(x[3]-.5)^2 + 10*x[4] + 5*x[5]
}
cf_highdim(friedman, 5, color.palette=topo.colors)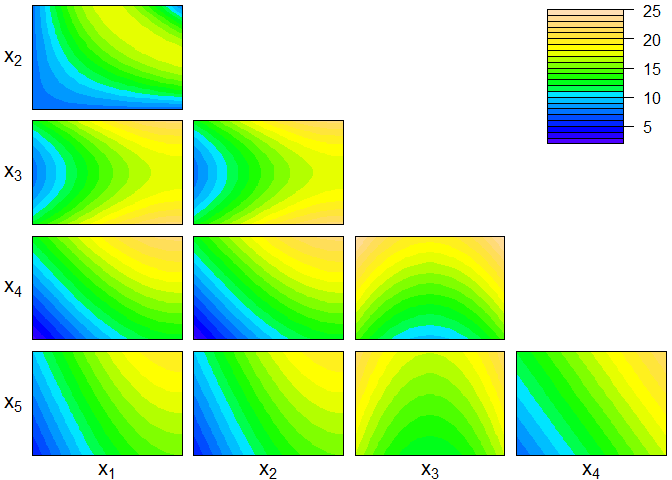
For (three or) four inputs dimensions:
cf_4dim(function(x) {x[1] + x[2]^2 + sin(2*pi*x[3])})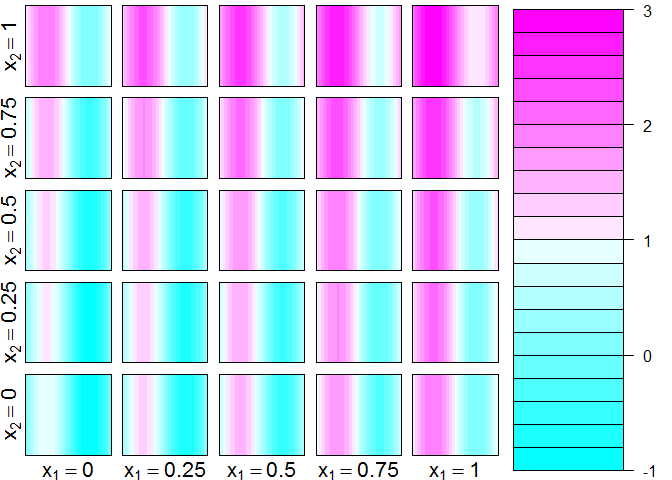
These binaries (installable software) and packages are in development.
They may not be fully stable and should be used with caution. We make no claims about them.
Health stats visible at Monitor.