The hardware and bandwidth for this mirror is donated by dogado GmbH, the Webhosting and Full Service-Cloud Provider. Check out our Wordpress Tutorial.
If you wish to report a bug, or if you are interested in having us mirror your free-software or open-source project, please feel free to contact us at mirror[@]dogado.de.
![]()
![]()
![]()
R interface to access, explore and visualize CEPALSTAT indicators
CEPALSTAT Portal · Paper (LACCEI 2024) · Report Issue
CepalStatR is an R package that provides a reproducible and user-friendly interface to access data and metadata from CEPALSTAT, the statistical portal of the Economic Commission for Latin America and the Caribbean (ECLAC/CEPAL).
The package is designed to simplify the interaction with the CEPALSTAT API, allowing users to:
It is particularly useful for researchers, analysts, and students working with Latin American and Caribbean statistics.
Install the development version from GitHub:
# install.packages("devtools")
devtools::install_github("Henry-Osorto/CepalStatR")library(CepalStatR)
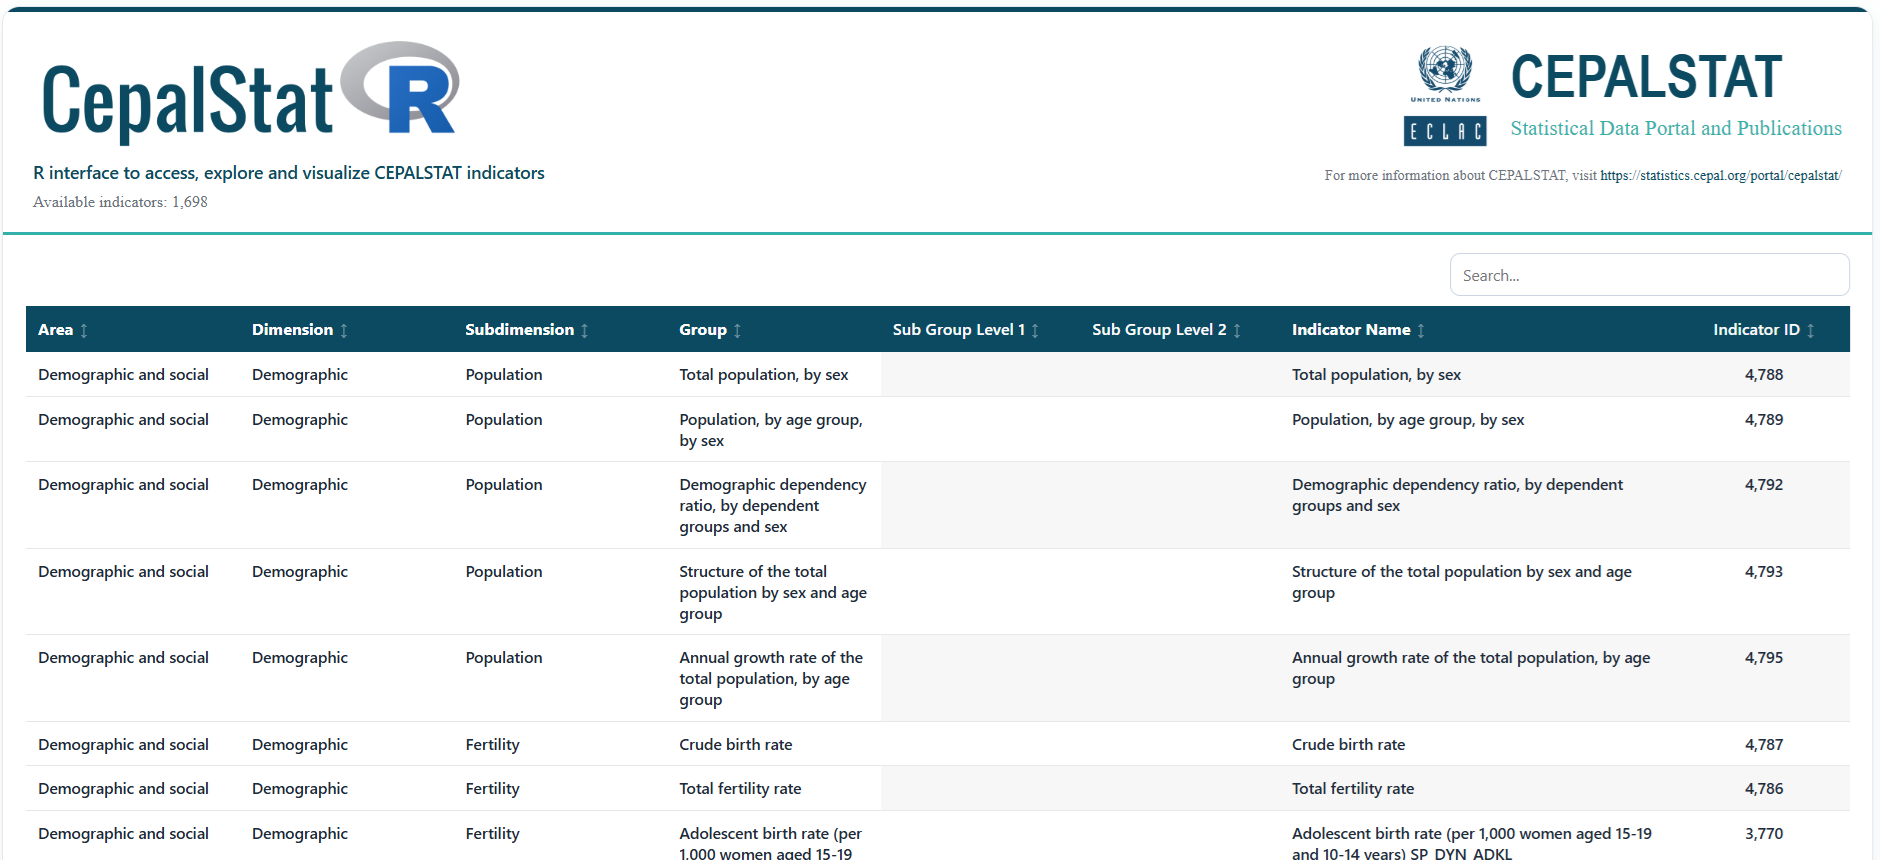
# Interactive indicator browser
viewer.indicators()
# Download the indicator hierarchy as a data frame
indicators <- call.indicators()
# Download indicator data
df <- call.data(id.indicator = 1)
# Available countries
countries()
# Population pyramids
pyramids(country = "Honduras", years = c(1, 5, 10, 15))
# SDG ranking
ranking.sdg(id.indicator = 3682)
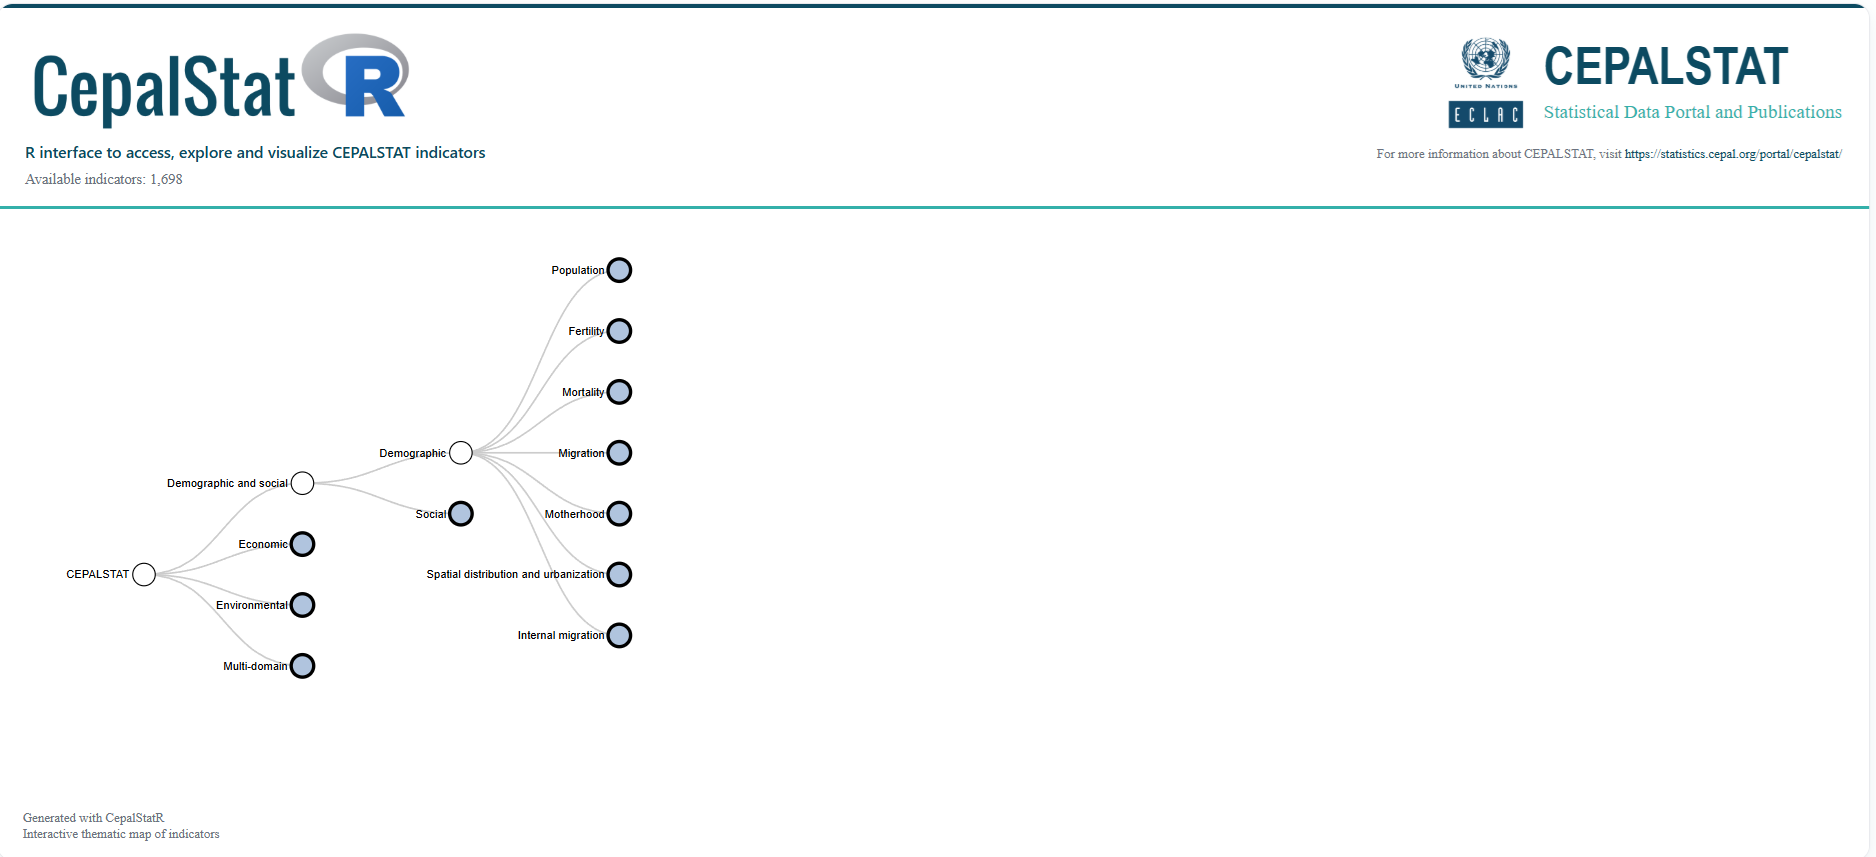
# Interactive thematic map
topic_map()call.indicators() — downloads the thematic structure of
CEPALSTAT indicatorsviewer.indicators() — displays the indicator hierarchy
in an interactive HTML tabletopic_map() — creates an interactive thematic tree of
indicatorscountries() — returns the list of available countries
from CEPALSTAT dimensionscall.data() — downloads indicator data and returns an
analysis-ready data framepyramids() — generates population pyramids using
CEPALSTAT demographic indicatorsranking.sdg() — creates ranking plots for indicators
associated with the Sustainable Development Goals
All data and metadata are obtained from CEPALSTAT:
https://statistics.cepal.org/portal/cepalstat/
CEPALSTAT provides a rich statistical infrastructure for Latin America and the Caribbean, but direct use of its API may be cumbersome for many users. CepalStatR simplifies that process by offering a consistent R interface for metadata discovery, reproducible data acquisition, tidy outputs, and built-in visual tools for exploratory and applied analysis.
This makes the package especially suitable for:
If you use CepalStatR in academic work, please cite the conference paper that documents the package:
Osorto, H. (2024). CepalStatR: a package in R for access to ECLAC statistics. 22nd LACCEI International Multi-Conference for Engineering, Education, and Technology. https://doi.org/10.18687/LACCEI2024.1.1.1473
@inproceedings{Osorto2024CepalStatR,
  author    = {Henry Osorto},
  title     = {CepalStatR: a package in R for access to ECLAC statistics},
  booktitle = {22nd LACCEI International Multi-Conference for Engineering, Education, and Technology},
  year      = {2024},
  doi       = {10.18687/LACCEI2024.1.1.1473}
}The package currently includes a CRAN-ready structure, interactive exploration tools, indicator retrieval functions, and built-in visualization features. Future development may extend the package with additional metadata utilities, thematic graphics, and analytical workflows.
Bug reports, suggestions, and feature requests are welcome through the GitHub issue tracker:
https://github.com/Henry-Osorto/CepalStatR/issues
These binaries (installable software) and packages are in development.
They may not be fully stable and should be used with caution. We make no claims about them.
Health stats visible at Monitor.