
The hardware and bandwidth for this mirror is donated by dogado GmbH, the Webhosting and Full Service-Cloud Provider. Check out our Wordpress Tutorial.
If you wish to report a bug, or if you are interested in having us mirror your free-software or open-source project, please feel free to contact us at mirror[@]dogado.de.
The goal of CLIQUE is to compute local variable importance values for a dataset, conditioned on a model.
You can install the development version of CLIQUE from GitHub with:
# install.packages("pak")
pak::pak("KelvynBladen/CLIQUE")This is a basic workflow which shows how to implement clique and derive meaningful insights from the resulting importance values:
library(CLIQUE)
library(palmerpenguins)
library(tidyverse)
penguins = palmerpenguins::penguins |> filter(!is.na(bill_length_mm)) |>
select(!sex)v <- clique(formula = factor(species) ~ ., data = penguins,
method = "rf", cores = 2, parallel = F)
temp = v$local_imp
colnames(temp) = paste0(colnames(temp), "_imp")
df = data.frame(penguins, temp)ggplot(df, aes(x = bill_length_mm, y = bill_length_mm_imp)) +
geom_point()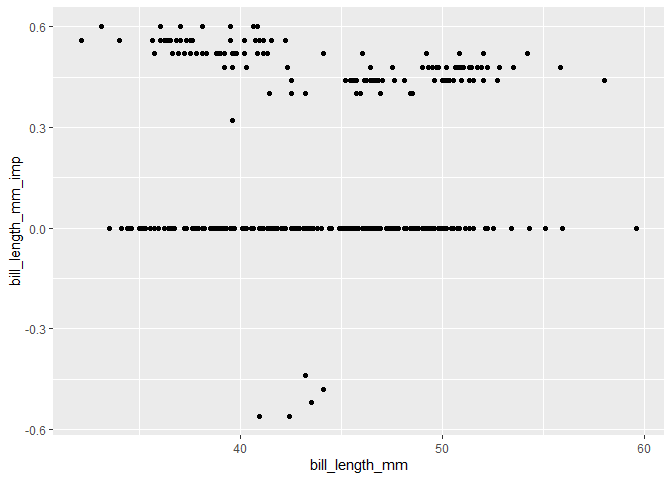
ggplot(df, aes(x = bill_length_mm, y = bill_length_mm_imp, colour = species)) +
  geom_point()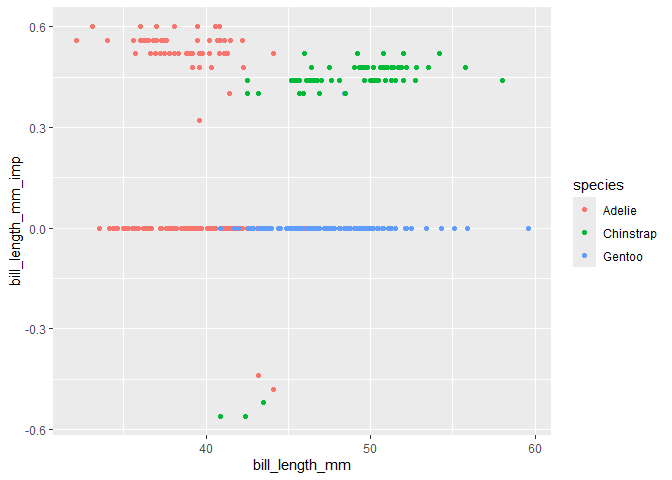
ggplot(df, aes(x = bill_length_mm, y = bill_length_mm_imp, colour = island)) +
  geom_point()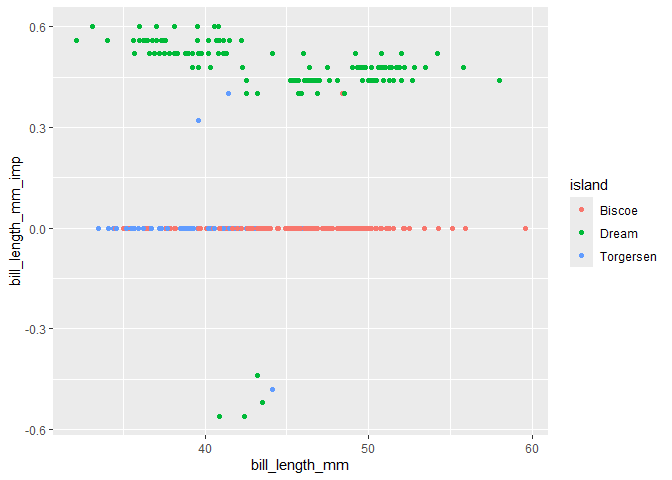
t329 = temp[329, ] |> pivot_longer(cols = everything()) |>
  arrange(desc(value))

t329$name <- factor(t329$name, levels = rev(t329$name))

ggplot(t329, aes(x = value, y = name)) + geom_point()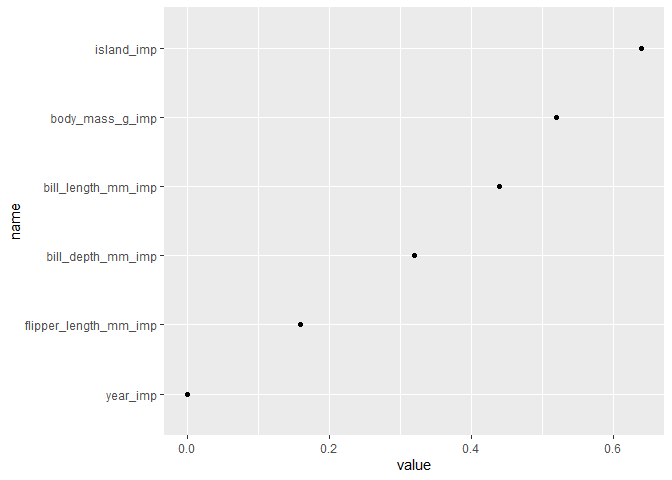
t339 = temp[339, ] |> pivot_longer(cols = everything()) |>
  arrange(desc(value))

t339$name <- factor(t339$name, levels = rev(t339$name))

ggplot(t339, aes(x = value, y = name)) + geom_point()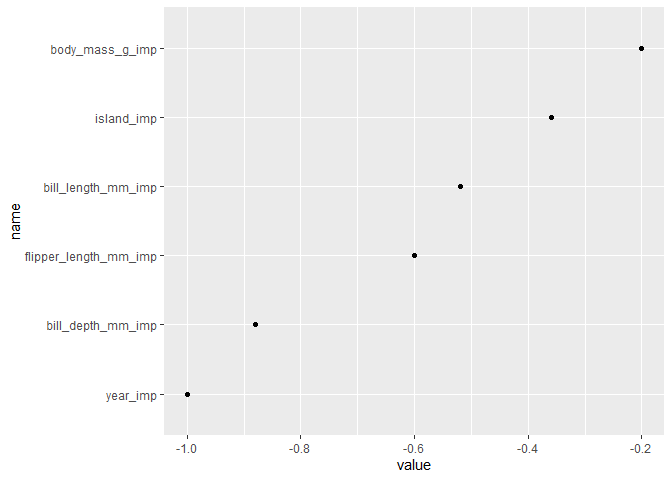
temp$species = penguins$species

ta = temp |> group_by(species) |>
  summarise(across(where(is.numeric), \(x) mean(x))) |>
  pivot_longer(cols = 2:7) |> arrange(desc(value))
ta$name <- factor(ta$name, levels = rev(unique(ta$name)))

ggplot(ta, aes(x = value, y = name)) + geom_point() +
  ggh4x::facet_wrap2(~species, dir = "v", strip.position = "right")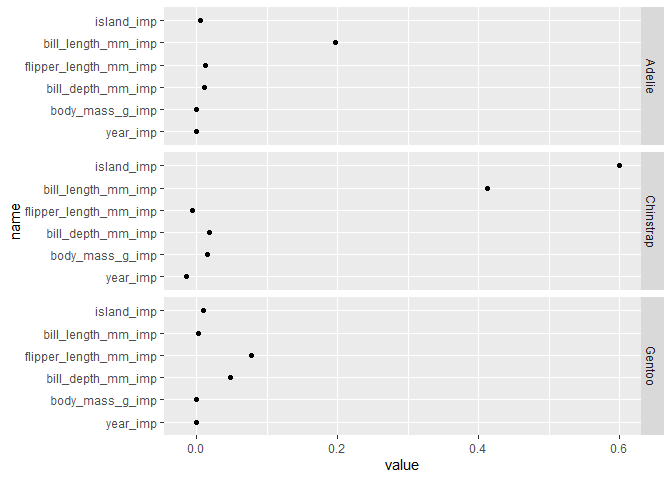
ggplot(temp, aes(x = species, y = bill_length_mm_imp)) +
  geom_boxplot()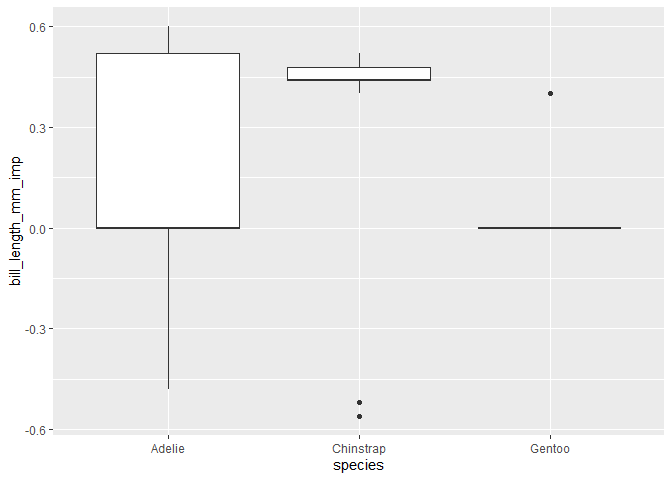
These binaries (installable software) and packages are in development.
They may not be fully stable and should be used with caution. We make no claims about them.
Health stats visible at Monitor.