




The hardware and bandwidth for this mirror is donated by dogado GmbH, the Webhosting and Full Service-Cloud Provider. Check out our Wordpress Tutorial.
If you wish to report a bug, or if you are interested in having us mirror your free-software or open-source project, please feel free to contact us at mirror[@]dogado.de.
AIDA provides tools for the analysis of
interval-valued data, including construction, visualization, robust
estimation, and outlier detection. The R package is built around the
intData class and is designed to support methodological
research and applied workflows involving interval-valued data.
AIDA currently includes functionality for:
You can install the development version from GitHub:
# install.packages("pak")
pak::pak("catarinaploureiro/AIDA")library(AIDA)
#>
#> Attaching package: 'AIDA'
#> The following object is masked from 'package:base':
#>
#> rbind
# Create an intData object from the iris dataset, using the Species column as
# grouping variable. We also specify the latent distribution as "General" to
# estimate the parameters based on the microdata.
data(iris)
iris_int <- micro2intData(iris[,1:4], iris$Species, LatentCase = "General")
# Check the parameters of the latent distribution
iris_int@LatentParam
#> [[1]]
#> [,1] [,2] [,3] [,4]
#> [1,] 0.1835903 0.1554921 0.1660354 0.1990067
#> [2,] 0.1554921 0.1381013 0.1461729 0.1683492
#> [3,] 0.1660354 0.1461729 0.1627440 0.1828199
#> [4,] 0.1990067 0.1683492 0.1828199 0.2704900
#>
#> [[2]]
#> [,1] [,2] [,3] [,4]
#> [1,] 0.01851852 0.00000000 0.00000000 0.0000000
#> [2,] 0.00000000 0.04199507 0.00000000 0.0000000
#> [3,] 0.00000000 0.00000000 0.02913753 0.0000000
#> [4,] 0.00000000 0.00000000 0.00000000 -0.1802821
# Compute the classical covariance and correlation matrices
iris_cov <- int_cov(iris_int)
iris_corr <- cov2cor(iris_cov)
# Pairs plot, the lower triangular shows scatter plots of the four variables,
# while the upper triangular shows the interval correlation matrix.
plot_pairs_int(iris_int, corr = iris_corr, labels = colnames(iris_int))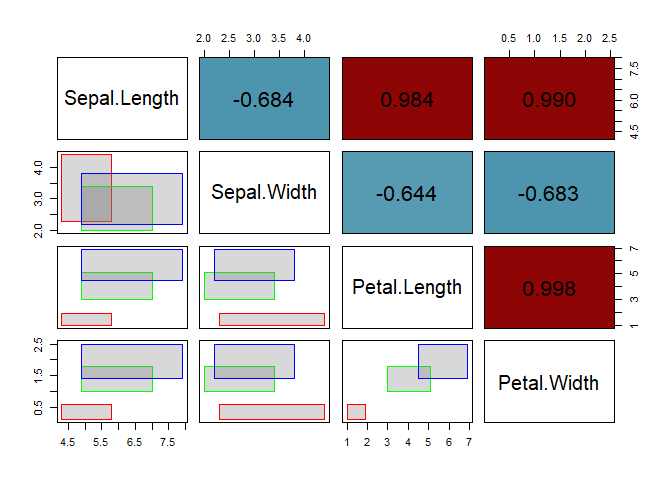
For a full introduction about the intData class
(Oliveira, Pinheiro, and Oliveira (2025)), see:
vignette("intData_examples", package = "AIDA")For examples on the IMCD estimator and outlier detection based on the robust squared Interval-Mahalanobis distance (Loureiro et al. (2026b)), see:
vignette("IMCD_examples", package = "AIDA")For examples on explainable outlier detection using Shapley values (Loureiro et al. (2026a)), see:
vignette("Shapley_examples", package = "AIDA")These binaries (installable software) and packages are in development.
They may not be fully stable and should be used with caution. We make no claims about them.
Health stats visible at Monitor.