


Package rankinma supports users to easily obtain and visualize various metrics of treatment ranking from network meta-analysis no matter using frequentist or Bayesian approach. This package not only accepts manual-prepared data set of treatment ranking metrics from users, but also can help users to gather various treatment ranking metrics in network meta-analysis. Users can use functions in rankinma by calling the library with following syntax:
library(rankinma)rankinma allows users to visualize various treatment ranking metrics in network meta-analysis based either common-effect model or random-effects model. The current version includes three common metrics of treatment ranking.
Briefly, rankinma can be used for visualization of both detailed metrics of probabilities and global metrics (i.e. SUCRA and P-score). Besides, rankinma provides users multiple types of plots to illustrate aforementioned treatment ranking metrics, and current version consists of five types of plots with six sub-types.
Users can visualize treatment ranking after network meta-analysis in five steps, but have to check condition before using rankinma.
Situation 1: Users have data for network meta-analysis of a single outcome but do not get treatment ranking metrics yet.
Situation 2: Users have data for network
meta-analysis of various outcomes but do not get
treatment ranking metrics yet.
Step 1. Load data and do network meta-analysis.
Step 2. Get treatment ranking metrics from the
network meta-analysis using function GetMetrics().
Step 3. Setup data in rankinma format using
function SetMetrics().
Step 4. Visualization using function
PlotBeads(), PlotHeat(),
PlotBar(), or PlotLine().
Step 1. Load data and do network meta-analysis.
Step 2. Get treatment ranking metrics from the
network meta-analysis using function GetMetrics().
— Repeat step 1 and 2 for each outcome, and keep output of them for the further steps. —
Step 3. Combine treatment ranking metrics using
function rbind() in R base.
Step 4. Setup data in rankinma format using
function SetMetrics().
Step 5. Visualization using function
PlotBeads(), PlotHeat(),
PlotBar(), or PlotLine().
The following steps and syntax demonstrate how user can illustrate a summary of treatment ranking metrics on various outcomes from network meta-analysis.
Example 1 for illustrating line chart when users have data for network meta-analysis of a single outcome but do not get treatment ranking metrics yet.
STEP 1. Load data
library(netmeta) data(Senn2013) nmaOutput <- netmeta(TE, seTE, treat1, treat2, studlab, data = Senn2013, sm = "SMD")STEP 2. Get Probabilities
dataMetrics <- GetMetrics(nmaOutput, outcome = "HbA1c.random", prefer = "small", metrics = "Probabilities", model = "random", simt = 1000)STEP 3. Set data for rankinma
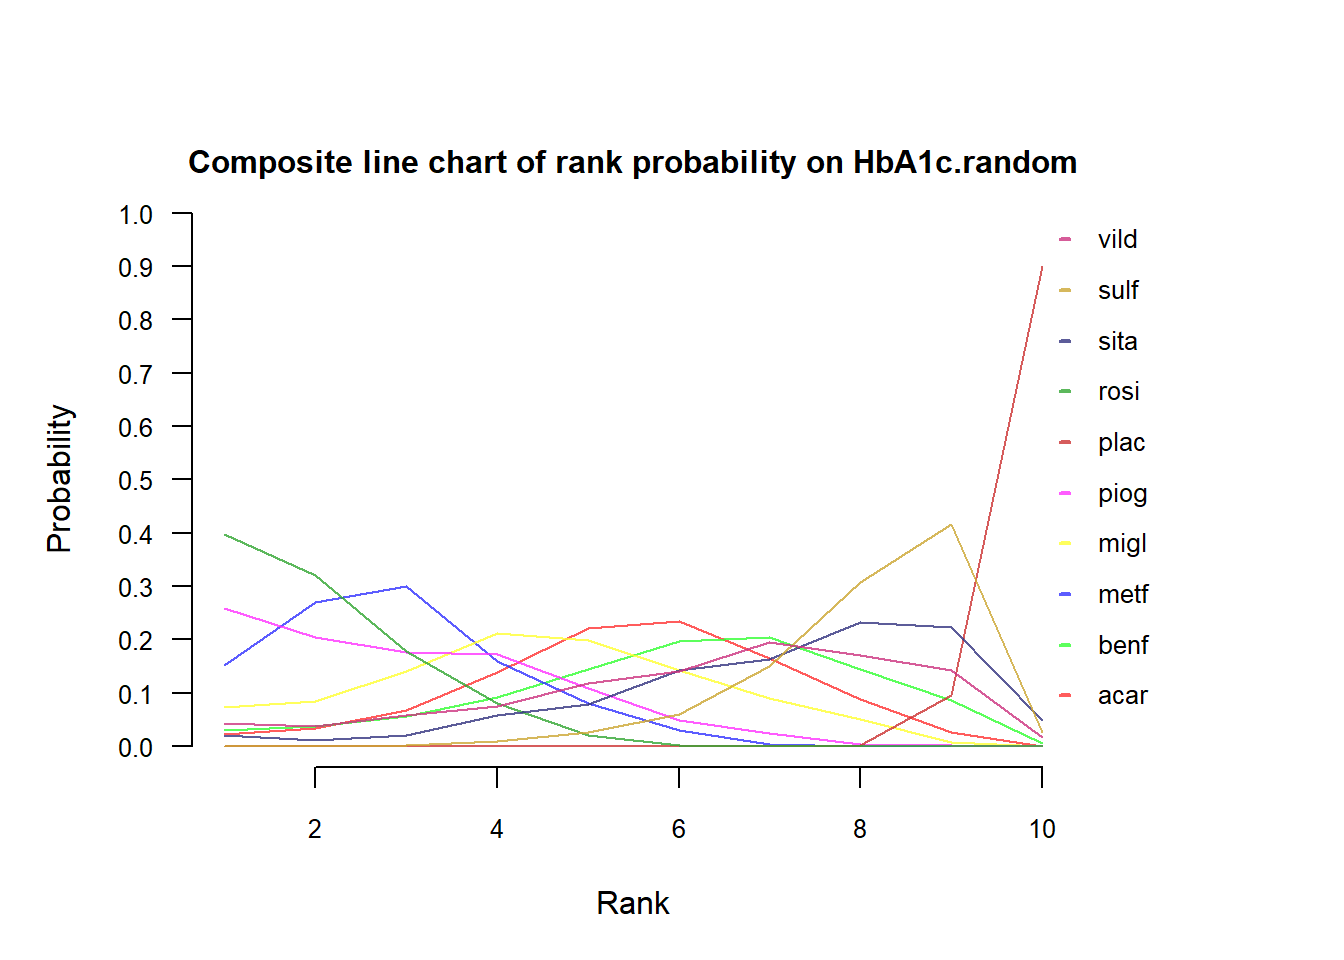
dataRankinma <- SetMetrics(dataMetrics, tx = tx, outcome = outcome, metrics.name = "Probabilities")STEP 4. Illustrate line chart
PlotLine(data = dataRankinma, compo = TRUE)Output:
#> Loading required package: meta #> Loading 'meta' package (version 6.5-0). #> Type 'help(meta)' for a brief overview. #> Readers of 'Meta-Analysis with R (Use R!)' should install #> older version of 'meta' package: https://tinyurl.com/dt4y5drs #> Loading 'netmeta' package (version 2.8-2). #> Type 'help("netmeta-package")' for a brief overview. #> Readers of 'Meta-Analysis with R (Use R!)' should install #> older version of 'netmeta' package: https://tinyurl.com/kyz6wjbb
Figure 2A. an exmaple of composite line chart for probabilities of treatments on each rank.
or

Figure 2B. an example of accumulative bar chart for probabilities of treatments on each rank.
Example 2 for illustrating beading plot when users have data for network meta-analysis of multiple outcomes but do not get treatment ranking metrics yet.
STEP 1. Load data
library(netmeta) data(Senn2013) nmaOutput <- netmeta(TE, seTE, treat1, treat2, studlab, data = Senn2013, sm = "SMD")STEP 2. Get SUCRA
nmaRandom <- GetMetrics(nmaOutput, outcome = "HbA1c.random", prefer = "small", metrics = "P-score", model = "random", simt = 1000) nmaCommon <- GetMetrics(nmaOutput, outcome = "HbA1c.common", prefer = "small", metrics = "P-score", model = "common", simt = 1000)STEP 3. Combine metrics from multiple outcomes
dataMetrics <- rbind(nmaRandom, nmaCommon)STEP 4. Set data for rankinma
dataRankinma <- (dataMetrics, tx = tx, outcome = outcome, metrics = P.score, metrics.name = "P-score")STEP 5. Illustrate beading plot
PlotBeads(data = dataRankinma)Output:
#> Summary of metrics: #> Metrics: P-score #> Outcomes: 1 #> Treatments: 10 #> #> List of treatments: #> 1 acar #> 2 benf #> 3 metf #> 4 migl #> 5 piog #> 6 plac #> 7 rosi #> 8 sita #> #> 9 sulf #> 10 vild #> Summary of metrics: #> Metrics: P-score #> Outcomes: 1 #> Treatments: 10 #> #> List of treatments: #> 1 acar #> 2 benf #> 3 metf #> 4 migl #> 5 piog #> 6 plac #> 7 rosi #> 8 sita #> #> 9 sulf #> 10 vild #> #> #> Summary of metrics: #> Metrics: P-score #> Outcomes: 2 #> Treatments: 10 #> #> List of outcomes: #> 1 HbA1c.random #> 2 HbA1c.common #> List of treatments: #> 1 acar #> 2 benf #> 3 metf #> 4 migl #> 5 piog #> 6 plac #> 7 rosi #> 8 sita #> #> 9 sulf #> 10 vild
Figure 3. an example of beading plot for P-score on two outcomes
Salanti, G., Ades, A. E., & Ioannidis, J. P. (2011). Graphical methods and numerical summaries for presenting results from multiple-treatment meta-analysis: an overview and tutorial. Journal of clinical epidemiology, 64(2), 163-171.
Chaimani, A., Higgins, J. P., Mavridis, D., Spyridonos, P., & Salanti, G. (2013). Graphical tools for network meta-analysis in STATA. PloS one, 8(10), e76654.
Van Valkenhoef, G., Tervonen, T., Zwinkels, T., De Brock, B., & Hillege, H. (2013). ADDIS: a decision support system for evidence-based medicine. Decision Support Systems, 55(2), 459-475.
Rücker, G., & Schwarzer, G. (2015). Ranking treatments in frequentist network meta-analysis works without resampling methods. BMC medical research methodology, 15(1), 1-9.
Daly, C. H., Mbuagbaw, L., Thabane, L., Straus, S. E., & Hamid, J. S. (2020). Spie charts for quantifying treatment effectiveness and safety in multiple outcome network meta-analysis: a proof-of-concept study. BMC Medical Research Methodology, 20, 1-13.
Balduzzi, S., Rücker, G., Nikolakopoulou, A., Papakonstantinou, T., Salanti, G., Efthimiou, O., & Schwarzer, G. (2023). netmeta: An R package for network meta-analysis using frequentist methods. Journal of Statistical Software, 106, 1-40.