The hardware and bandwidth for this mirror is donated by dogado GmbH, the Webhosting and Full Service-Cloud Provider. Check out our Wordpress Tutorial.
If you wish to report a bug, or if you are interested in having us mirror your free-software or open-source project, please feel free to contact us at mirror[@]dogado.de.
![]()
usportsR is a package that is designed to provide users
with data from all Usports sanctioned sports.
The package contains U Sports data spanning over a decade of pre-season, regular season, and post-season matches.
Sports currently included are Soccer, Basketball, Ice Hockey, Field Hockey, Track and Field Field Hockey, Football, Wrestling, Swimming and Rugby
We currently provide access to box score, play-by-play, schedules and rankings data
You can install the development version of usportsR from GitHub with:
# install.packages("devtools")
devtools::install_github("uwaggs/usportsR")This is a basic example which shows you how to solve a common problem:
library(usportsR)
library(dplyr)
#>
#> Attaching package: 'dplyr'
#> The following objects are masked from 'package:stats':
#>
#>     filter, lag
#> The following objects are masked from 'package:base':
#>
#>     intersect, setdiff, setequal, union
## basic example to find number of 40+ point games in the last decade

mens_player_box_scores <- basketball_player_box_score("m",c(2023,2022,2021,2019,2018,2017,2016,2015,2014))
mens_40_pt_games <- mens_player_box_scores %>% filter(pts >= 40)
head(mens_40_pt_games,10)
#> # A tibble: 10 × 25
#>    player        min   fgm   fga three_pm three_pa   ftm   fta  oreb  dreb   reb
#>    <chr>       <int> <int> <int>    <int>    <int> <int> <int> <int> <int> <int>
#>  1 Brandon Me…    34    13    24       10       17     5     5     0     5     5
#>  2 Evan Shadk…    49    14    27        7       16     5     6     1     2     3
#>  3 Malcolm Ch…    39    14    26        8       17    15    15     1     1     2
#>  4 Keivonte W…    34    16    22        5        6     3     3     0     3     3
#>  5 Glen Cox       35    16    29        3        5    10    11     4     7    11
#>  6 Osman Omar     33    14    30        3        8    11    11     1     1     2
#>  7 Inaki Alva…    33    14    22        6        8     6     8     1     2     3
#>  8 Diego Maff…    40    13    26        5       13    11    11     0     7     7
#>  9 Mason Bour…    40    14    19        7       10     6     6     0    12    12
#> 10 Osman Omar     43    15    28        2       10     9    11     4     5     9
#> # ℹ 14 more variables: ast <int>, stl <int>, blk <int>, to <int>, pf <int>,
#> #   pts <int>, starter <int>, player_number <int>, player_links <chr>,
#> # date <chr>, game_id <chr>, team_name <chr>, season <chr>, season_type <chr>library(ggplot2)
## simple plot to illustrate points vs assists in 40+ point games in Usport basketball games
ggplot(mens_40_pt_games,aes(x = pts,y = ast)) + geom_point() +
labs(title = "Points Vs Assists in 40 point games", x = "Points",y = "Assists")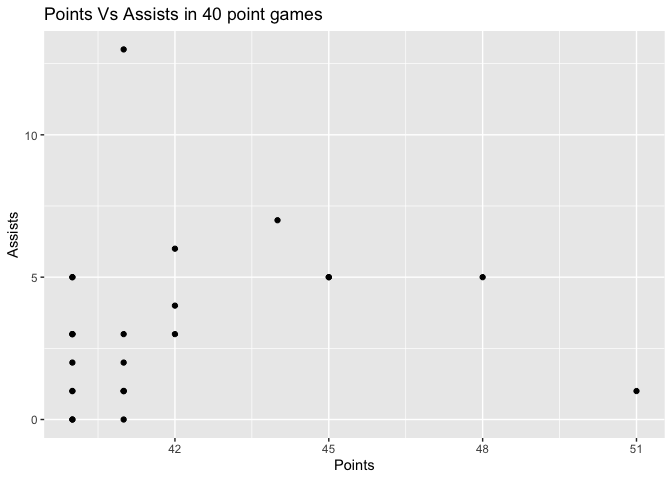
These binaries (installable software) and packages are in development.
They may not be fully stable and should be used with caution. We make no claims about them.
Health stats visible at Monitor.